Figure 1
Download original image
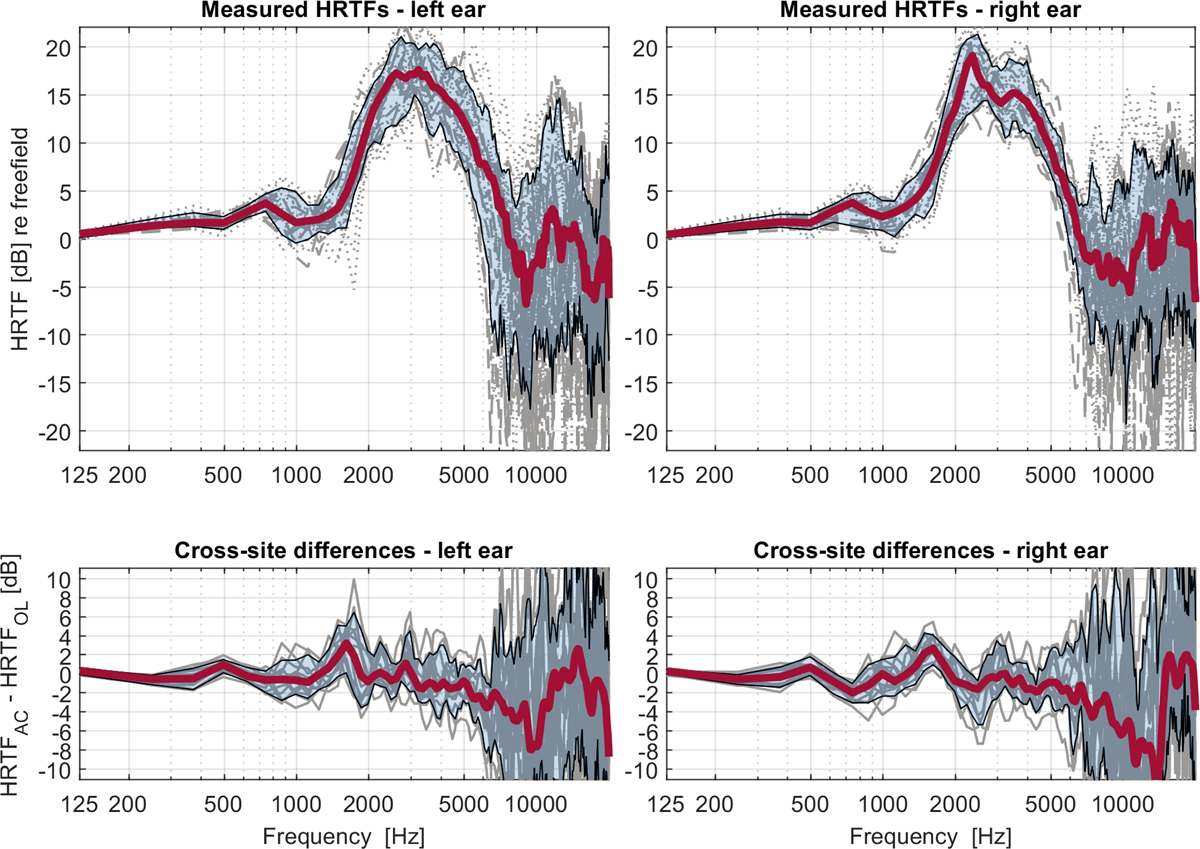
The upper row shows HRTF magnitude levels over a continuous frequency spectrum of a frontal sound source of participants that were measured at both sites using probe tube microphones positioned close to the eardrum. Left diagram relates to the left and the right diagram to the right ear. Red line shows the median, in transparent blue the range of 75% of measurement data around the median is plotted. Gray lines indicate an individual measurement. Dashed lines indicate a measurement in Aachen, dotted lines measurements in Oldenburg. The bottom row shows the difference in measurements for each participant between the HRTF measured in Aachen and Oldenburg for a frontal source. For the bottom diagrams, the median is averaged with one-twelfth octave band moving averaging window.
Current usage metrics show cumulative count of Article Views (full-text article views including HTML views, PDF and ePub downloads, according to the available data) and Abstracts Views on Vision4Press platform.
Data correspond to usage on the plateform after 2015. The current usage metrics is available 48-96 hours after online publication and is updated daily on week days.
Initial download of the metrics may take a while.