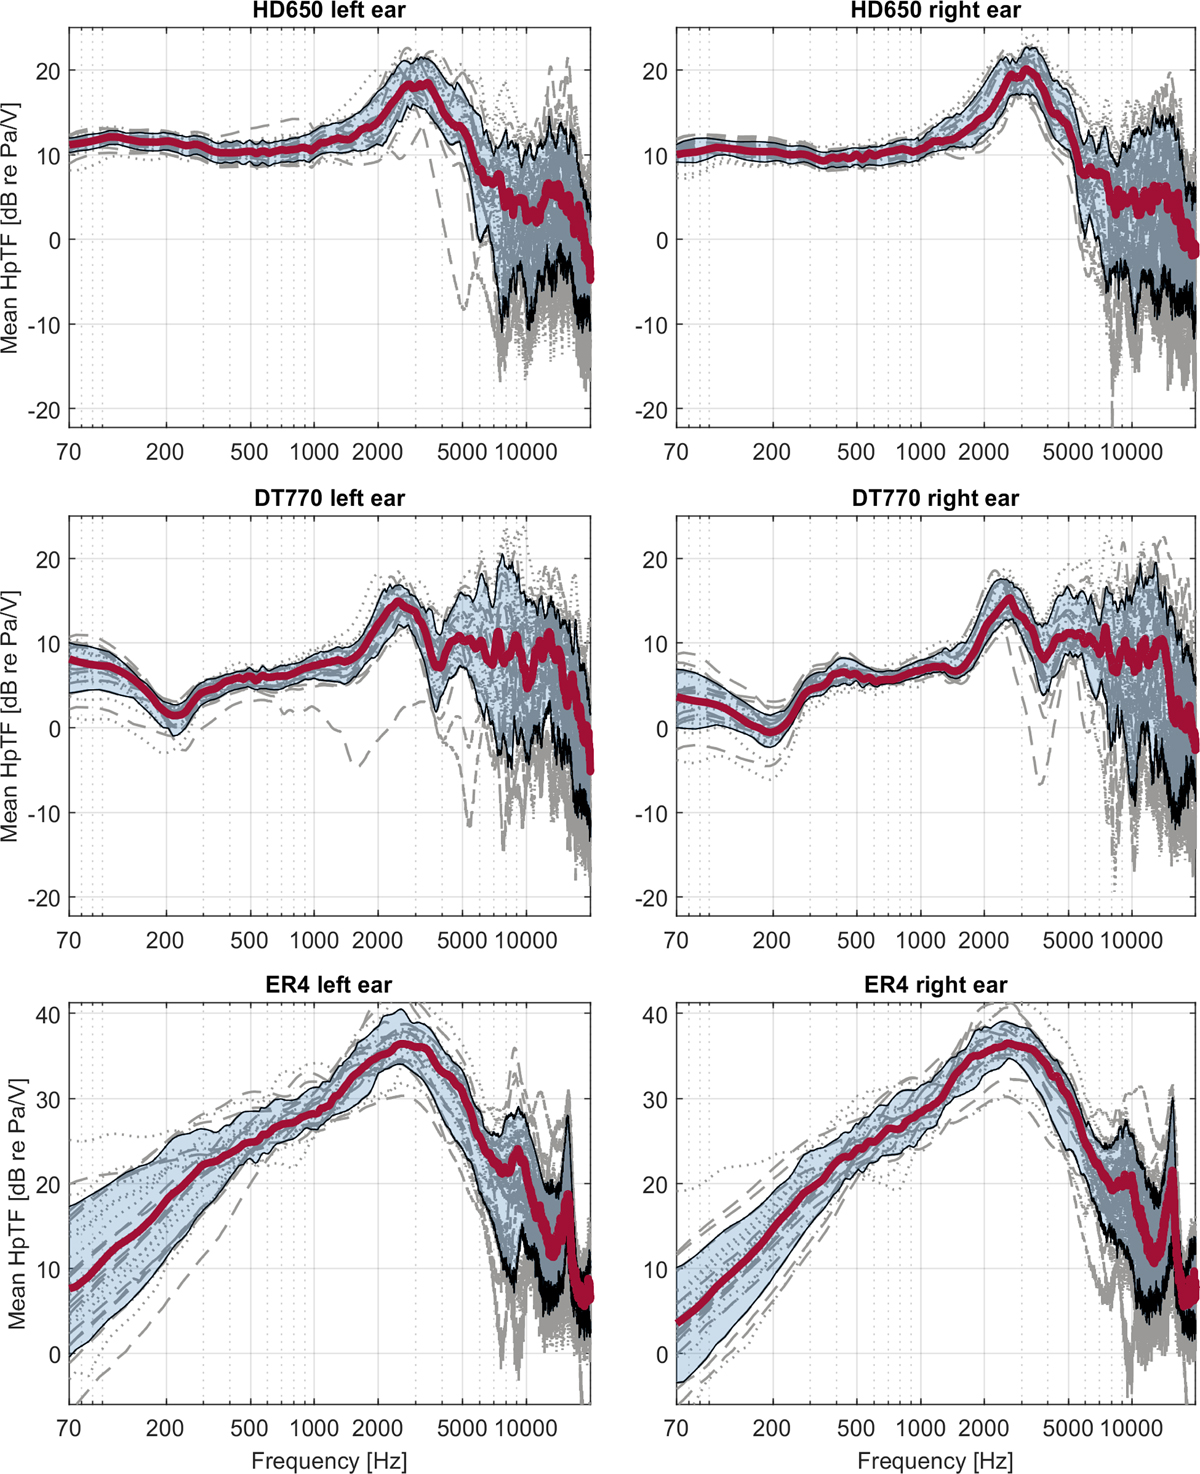
Figure 2
Download original image
HpTF magnitude levels for participants measured in Aachen and Oldenburg separated by left and right ear. Plotted is the mean over eight repetitions of the frequency magnitude. The sound pressure was measured close to the eardrum using probe tubes. The range of the y-axis differs for the ER4 measurements at the bottom. Red line shows the median, in transparent blue the range of 75% of measurement data around the median is plotted. Gray lines indicate the mean of one individual participant over up to eight repetitions. Dashed lines indicate a measurement in Aachen, dotted lines measurements in Oldenburg.
Current usage metrics show cumulative count of Article Views (full-text article views including HTML views, PDF and ePub downloads, according to the available data) and Abstracts Views on Vision4Press platform.
Data correspond to usage on the plateform after 2015. The current usage metrics is available 48-96 hours after online publication and is updated daily on week days.
Initial download of the metrics may take a while.