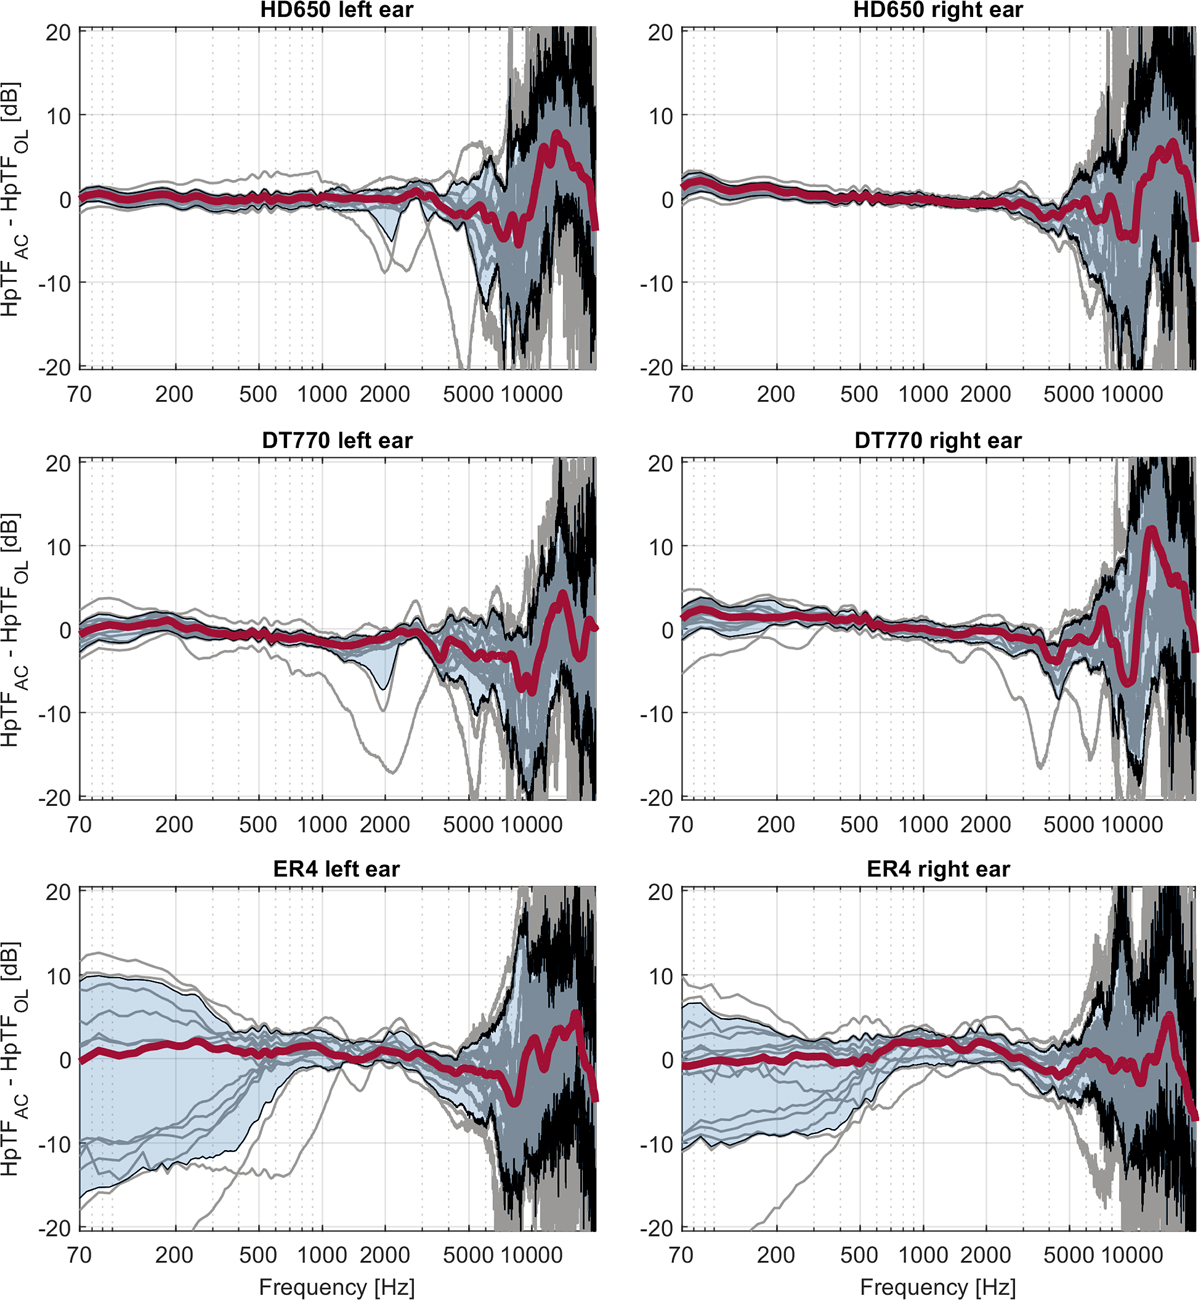
Figure 4

Download original image
Deviations of the obtained HpTF spectra for each participant across sites for the HpTF magnitude spectra for the different headphones separated by left and right ear. Microphones were positioned close to the eardrum using probe tubes. Left diagram relates to the left and the right diagram to the right ear. Red line shows the median (smoothed by one-twelfth moving average window), in transparent blue the range of 75% of measurement data around the median is plotted. Gray lines indicate an individual measurement.
Current usage metrics show cumulative count of Article Views (full-text article views including HTML views, PDF and ePub downloads, according to the available data) and Abstracts Views on Vision4Press platform.
Data correspond to usage on the plateform after 2015. The current usage metrics is available 48-96 hours after online publication and is updated daily on week days.
Initial download of the metrics may take a while.


