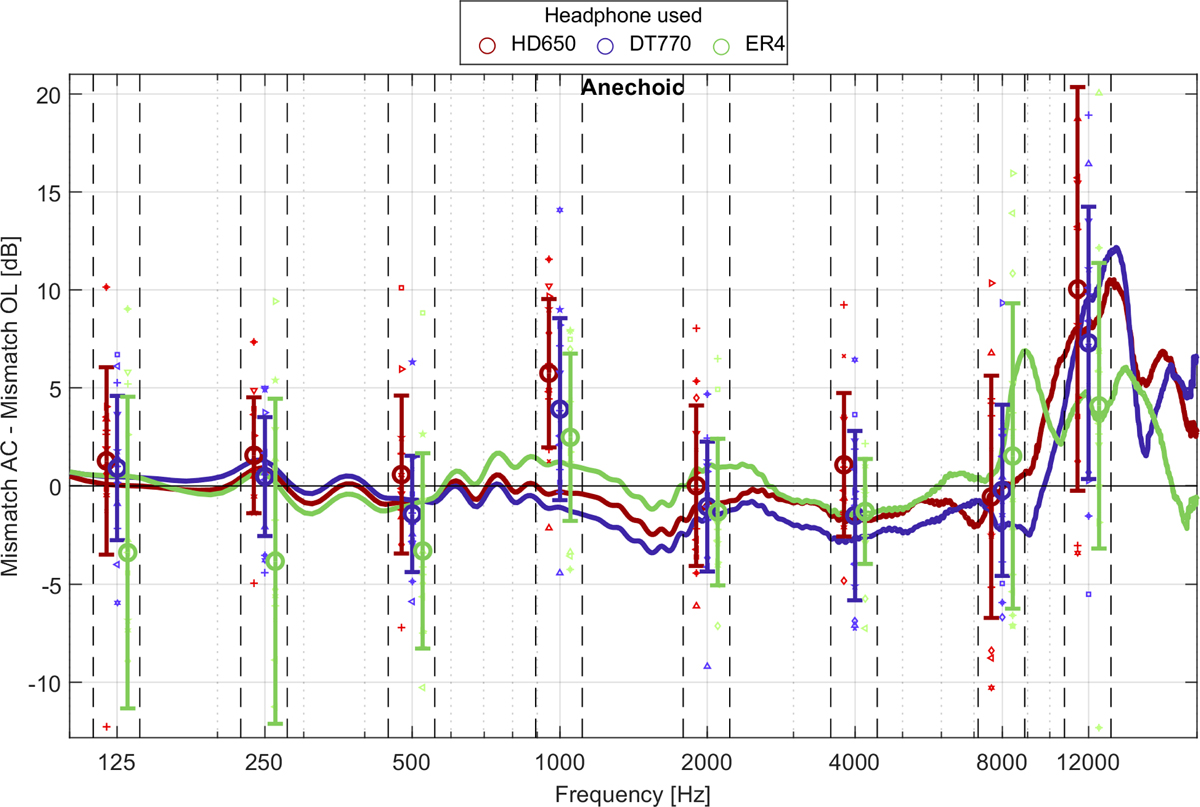
Figure 6
Download original image
Differences in individual mismatch between anechoic rooms in Aachen and Oldenburg. Each small marker is the difference for one specific participant, bigger markers the mean over all participants. Whisker denote the standard deviation. Colours represent one specific headphone type. Solid lines show the calculated mean deviations in mismatch due to the HpTF and HRTF average deviation across sites. The x-axis indicates the frequency with vertical lines showing the boundaries of the one-third octave bands employed for the stimuli in the listening tests. The red markers for HD650 and the green markers for the ER4 are shifted in frequency for better readability.
Current usage metrics show cumulative count of Article Views (full-text article views including HTML views, PDF and ePub downloads, according to the available data) and Abstracts Views on Vision4Press platform.
Data correspond to usage on the plateform after 2015. The current usage metrics is available 48-96 hours after online publication and is updated daily on week days.
Initial download of the metrics may take a while.