Figure 2
Download original image
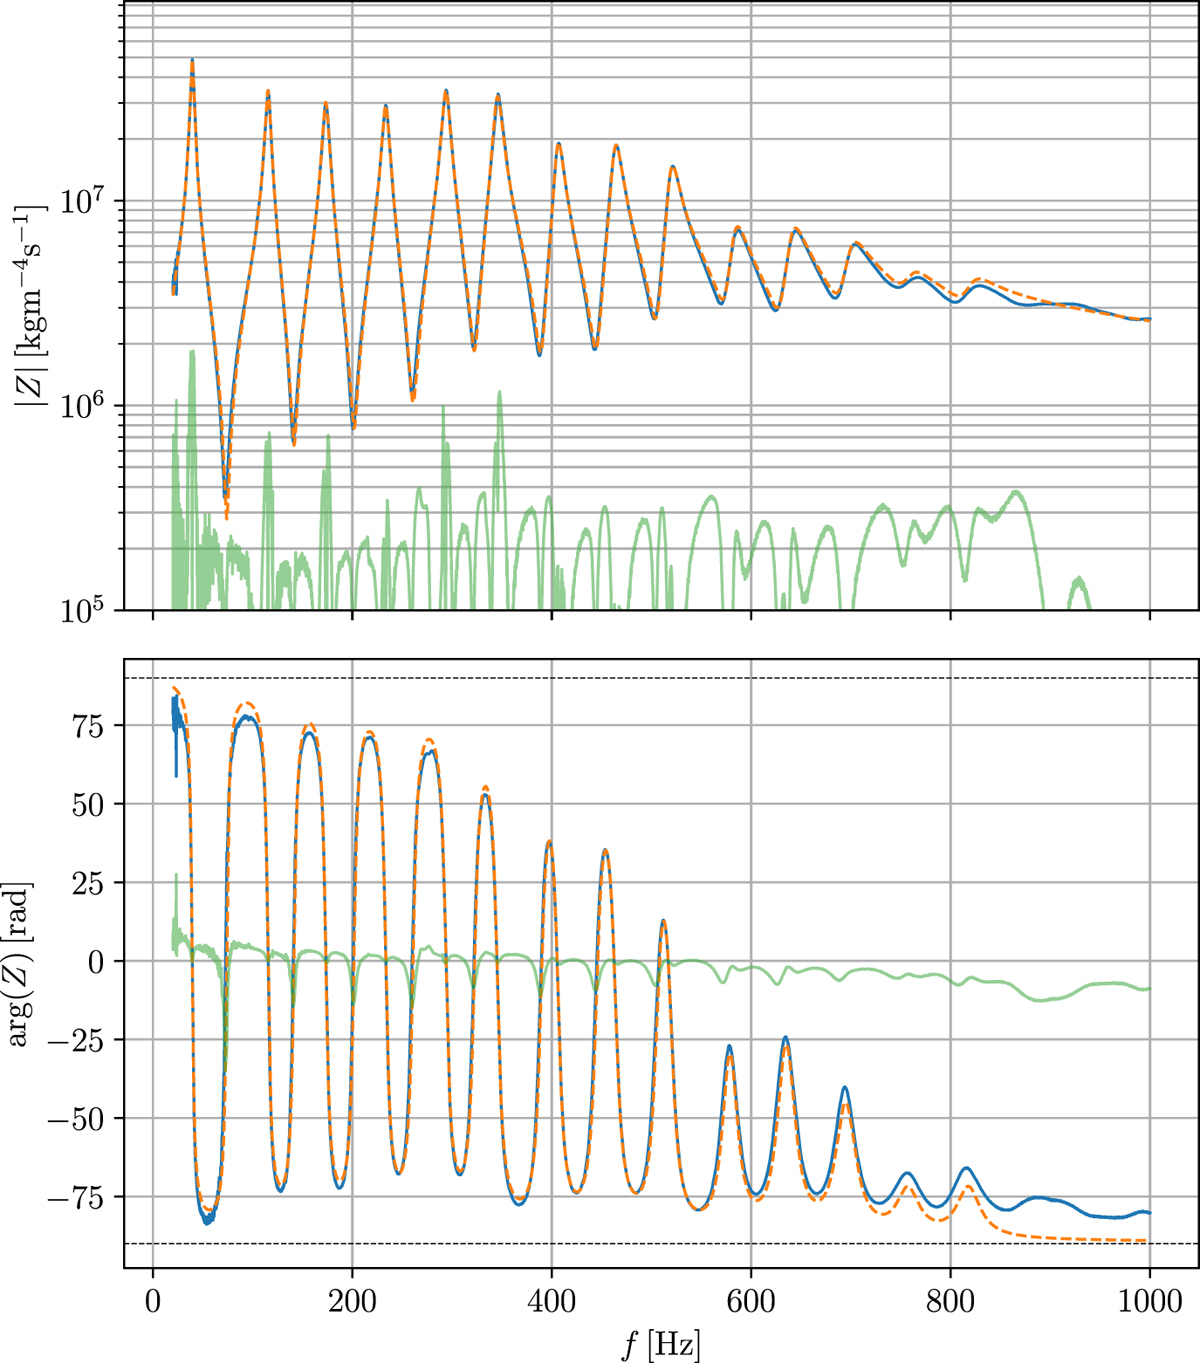
Modulus (top) and phase (bottom) of the input impedance of a bass trombone (A. Courtois Legend AC502) with respect to frequency. Blue curve: measured impedance; dashed orange curve: modal fit function with N = 15 modes; green curve: error between measured and fitted impedances, defined by ||Zfit| − |Zexp|| and arg(Zfit) − arg(Zexp) respectively as regards the module and phase.
Current usage metrics show cumulative count of Article Views (full-text article views including HTML views, PDF and ePub downloads, according to the available data) and Abstracts Views on Vision4Press platform.
Data correspond to usage on the plateform after 2015. The current usage metrics is available 48-96 hours after online publication and is updated daily on week days.
Initial download of the metrics may take a while.