Figure 4
Download original image
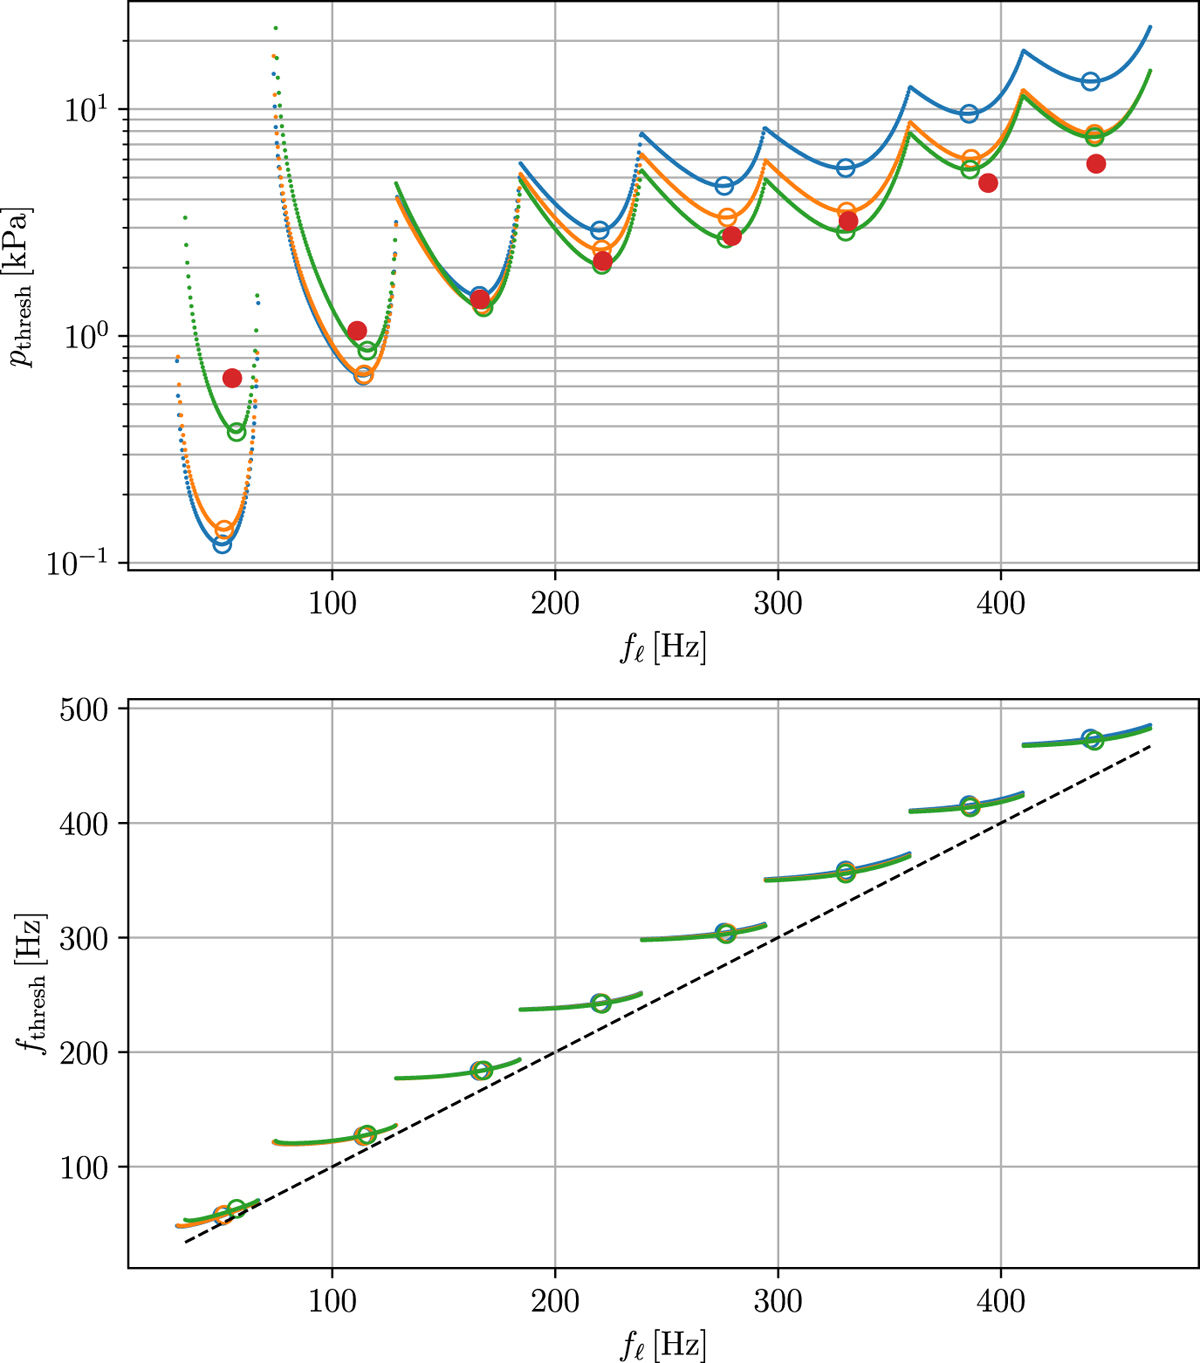
Results of the linear stability analysis with the constant, linear and inverse H-profile described on Figure 5. Top and bottom plots represent respectively the threshold mouth pressure and the threshold frequency versus the lips’ resonance frequency. Blue: H = h0, orange: ![]() , green:
, green: ![]() . Circles point out the minima of each U-shaped pattern on the top plot. Red points represent the experimental values of minimal threshold pressures given by [19]. The black dashed line on the bottom plot represents
. Circles point out the minima of each U-shaped pattern on the top plot. Red points represent the experimental values of minimal threshold pressures given by [19]. The black dashed line on the bottom plot represents ![]() .
.
Current usage metrics show cumulative count of Article Views (full-text article views including HTML views, PDF and ePub downloads, according to the available data) and Abstracts Views on Vision4Press platform.
Data correspond to usage on the plateform after 2015. The current usage metrics is available 48-96 hours after online publication and is updated daily on week days.
Initial download of the metrics may take a while.