Open Access
Figure 5
Download original image
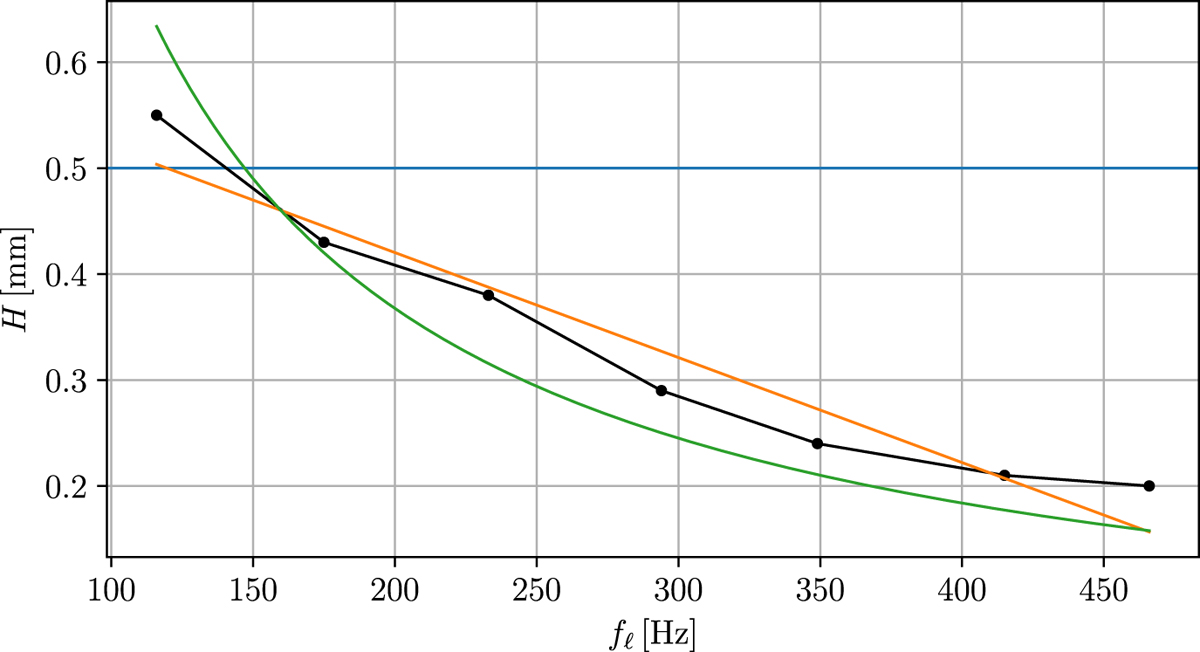
Considered H-profiles versus lips’ resonance frequency. Blue line corresponds to the constant value of H = h0 from [2], black points correspond to experimental data from [4], and the orange and green curves correspond to the regression functions chosen to fit the experimental points, respectively ![]() and
and ![]() .
.
Current usage metrics show cumulative count of Article Views (full-text article views including HTML views, PDF and ePub downloads, according to the available data) and Abstracts Views on Vision4Press platform.
Data correspond to usage on the plateform after 2015. The current usage metrics is available 48-96 hours after online publication and is updated daily on week days.
Initial download of the metrics may take a while.