Figure 7
Download original image
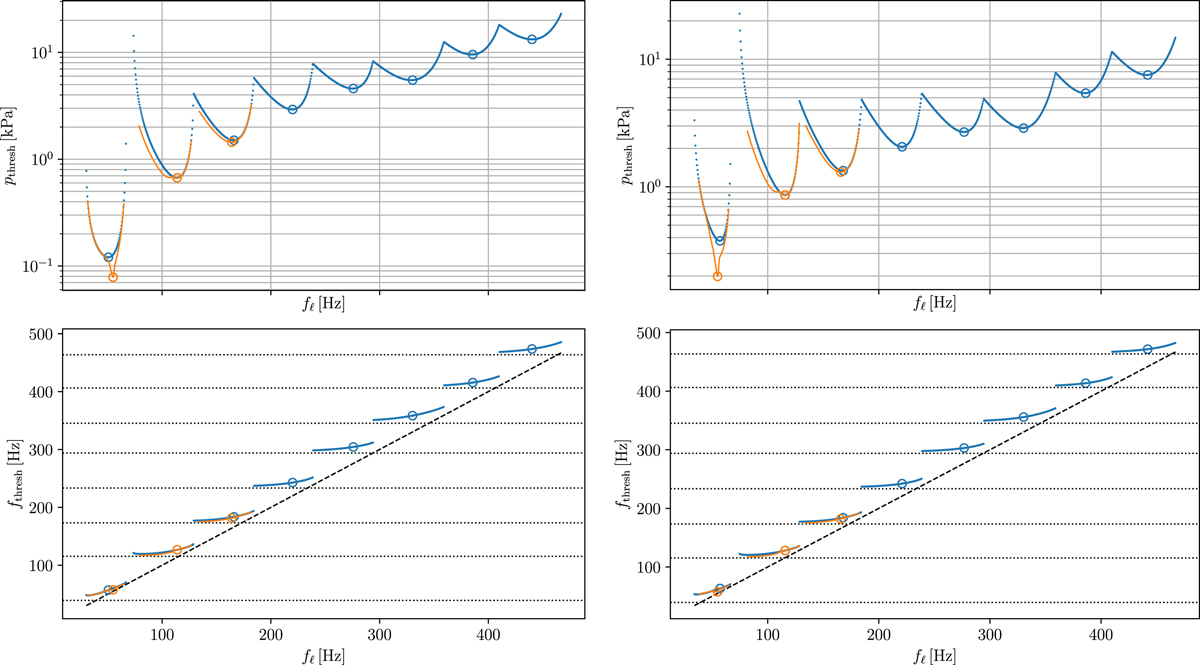
Top and bottom plots represent respectively the threshold pressures and threshold frequencies given by the linear stability analysis (blue) and the continuation method (orange) versus the lips’ frequency. Left: case H = h0; right: case ![]() . The circles identify the value of
. The circles identify the value of ![]() corresponding to a local minimum of blowing pressure. Horizontal dotted lines on the bottom plots locate the values of the acoustical resonances of the resonator; the black dashed line on the bottom plots represents
corresponding to a local minimum of blowing pressure. Horizontal dotted lines on the bottom plots locate the values of the acoustical resonances of the resonator; the black dashed line on the bottom plots represents ![]() .
.
Current usage metrics show cumulative count of Article Views (full-text article views including HTML views, PDF and ePub downloads, according to the available data) and Abstracts Views on Vision4Press platform.
Data correspond to usage on the plateform after 2015. The current usage metrics is available 48-96 hours after online publication and is updated daily on week days.
Initial download of the metrics may take a while.