Open Access
Figure 8
Download original image
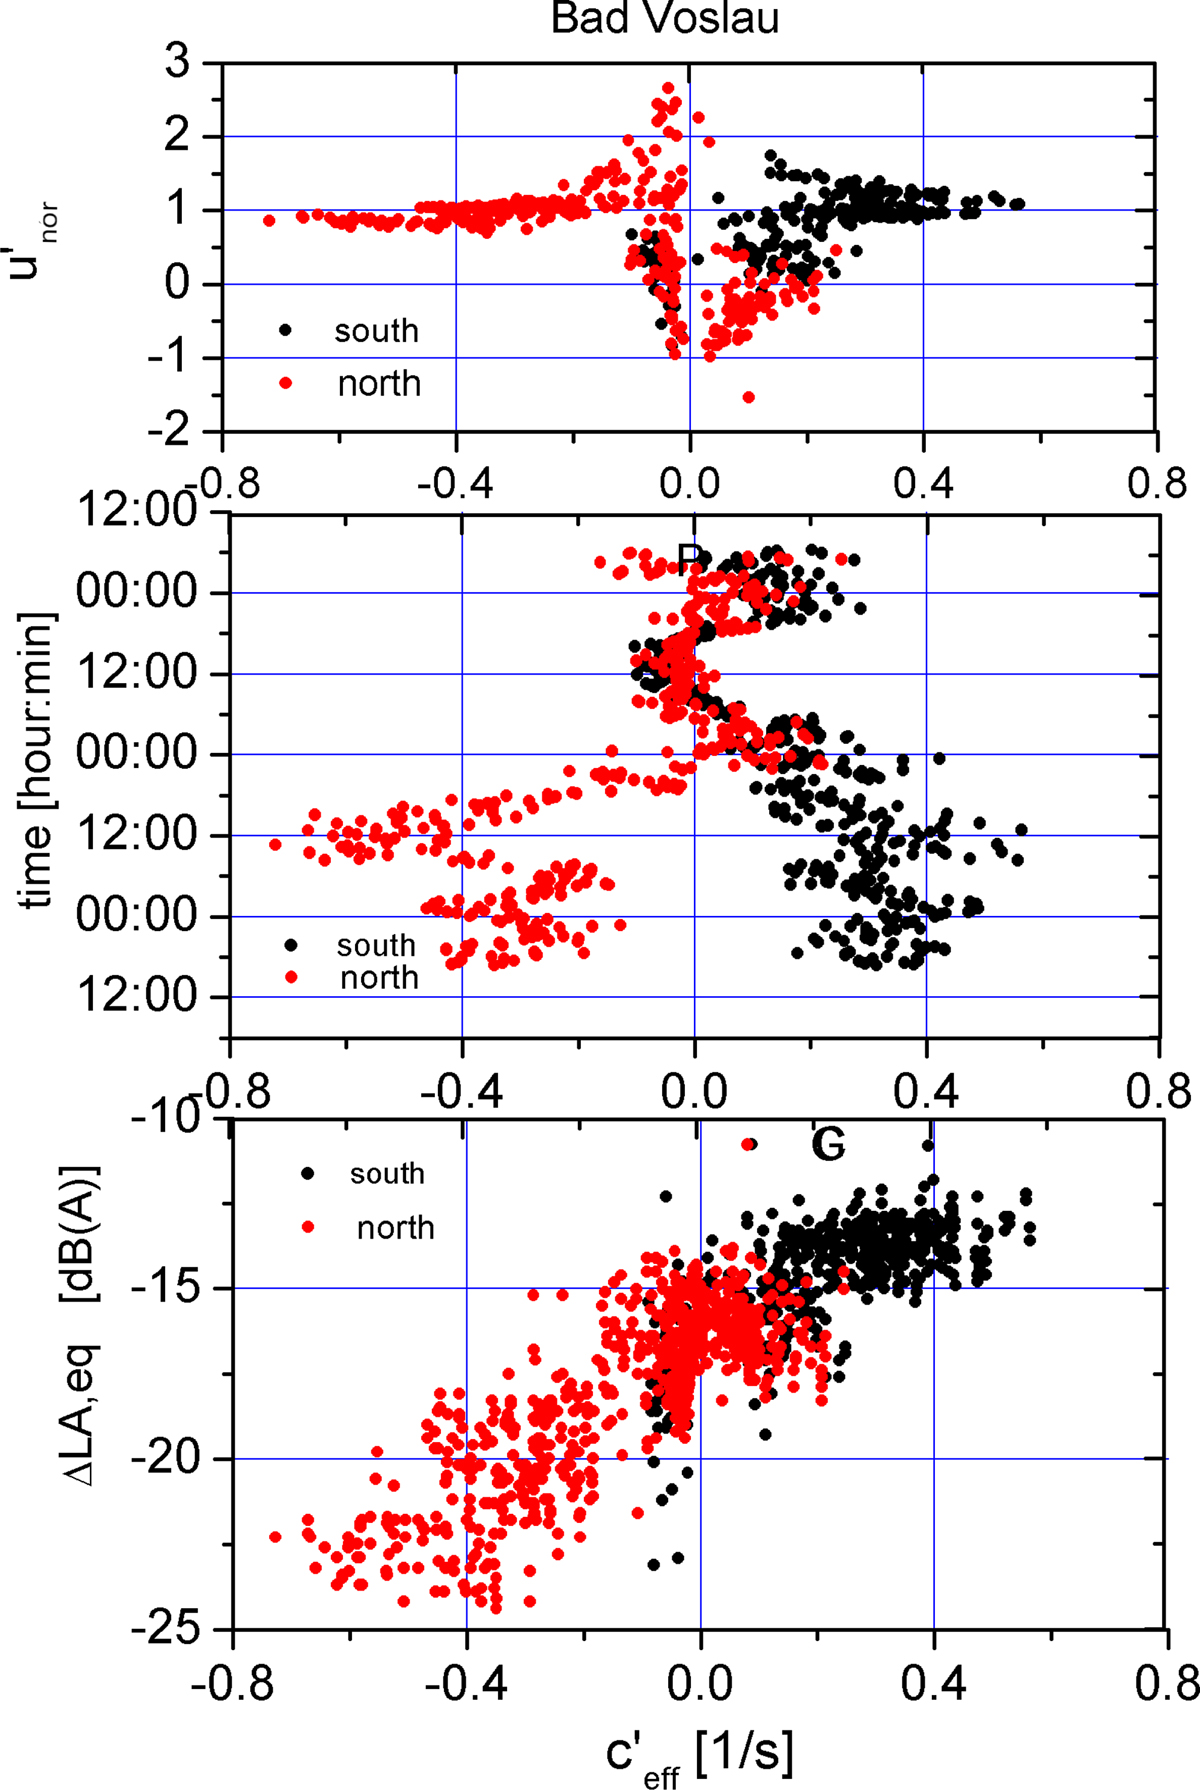
Bad Voeslau: The uppermost diagram shows the normalized wind speed gradient (![]() ). The middle figure depicts the temporal distribution of
). The middle figure depicts the temporal distribution of ![]() . The lowest graph shows the sound level difference ΔLA,eq versus the effective sound speed gradient differentiated for southern and northern measuring points.
. The lowest graph shows the sound level difference ΔLA,eq versus the effective sound speed gradient differentiated for southern and northern measuring points.
Current usage metrics show cumulative count of Article Views (full-text article views including HTML views, PDF and ePub downloads, according to the available data) and Abstracts Views on Vision4Press platform.
Data correspond to usage on the plateform after 2015. The current usage metrics is available 48-96 hours after online publication and is updated daily on week days.
Initial download of the metrics may take a while.