Figure 4
Download original image
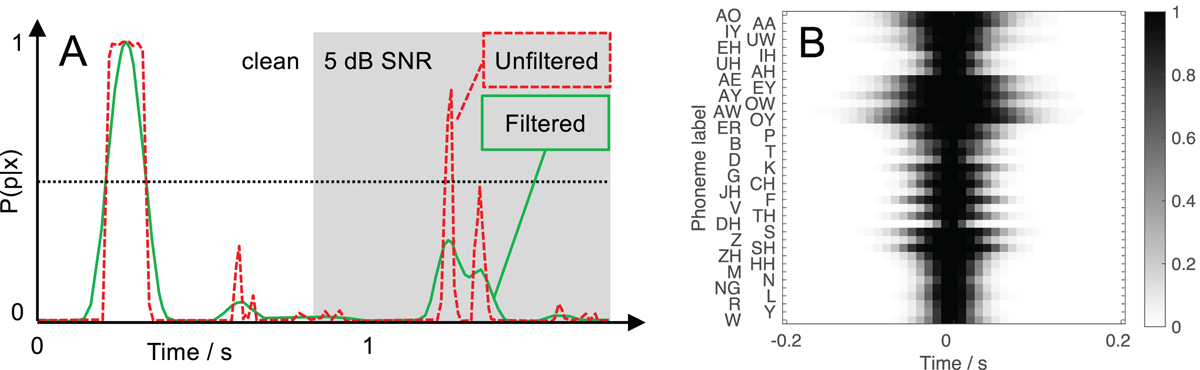
Panel A: Illustration of matched filtering: The clean activation of the phoneme /k/ (dashed red curve, clean condition on the left side) has a high match with the learned filter. Hence, the filter output (the convolution between filter and the activation) is high (solid green curve, filtered). The same phoneme in noise (5 dB SNR, gray background on the right side) results in an atypical activation (dashed red curve, right side), resulting in a filter output with smaller values. Panel B: Matched filters learned from the TIMIT speech database (high activation values (probabilities) are shown in black).
Current usage metrics show cumulative count of Article Views (full-text article views including HTML views, PDF and ePub downloads, according to the available data) and Abstracts Views on Vision4Press platform.
Data correspond to usage on the plateform after 2015. The current usage metrics is available 48-96 hours after online publication and is updated daily on week days.
Initial download of the metrics may take a while.