Figure 5
Download original image
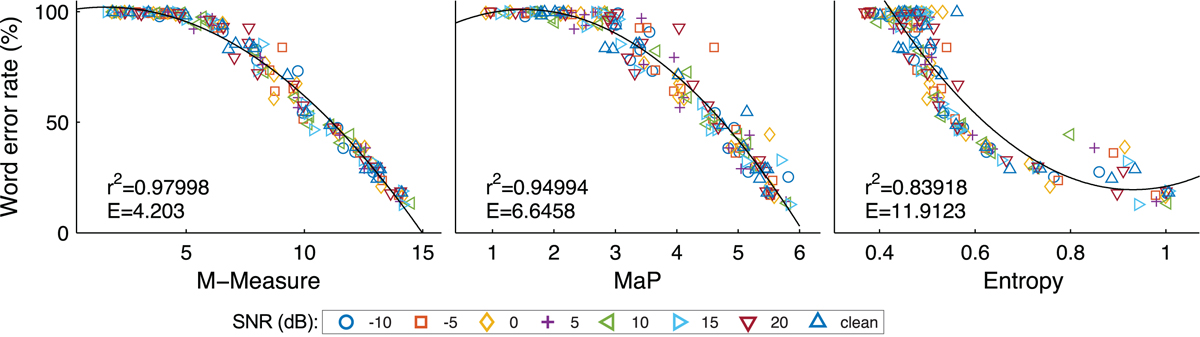
Word error rate over ASR-based speech quality measure (ASQM) values. Each data point corresponds to a specific noise type, SNR, beamforming angle, and environment (office or anechoic). Color/symbol denotes the SNR. The solid curve in each panel denotes a second-order polynomial fit to the data points between the according ASQM and word error rate. The correlation value r between fit and data and the goodness of the fit in terms of root mean square error E are given in the left bottom corner of each panel.
Current usage metrics show cumulative count of Article Views (full-text article views including HTML views, PDF and ePub downloads, according to the available data) and Abstracts Views on Vision4Press platform.
Data correspond to usage on the plateform after 2015. The current usage metrics is available 48-96 hours after online publication and is updated daily on week days.
Initial download of the metrics may take a while.