Open Access
Figure 1
Download original image
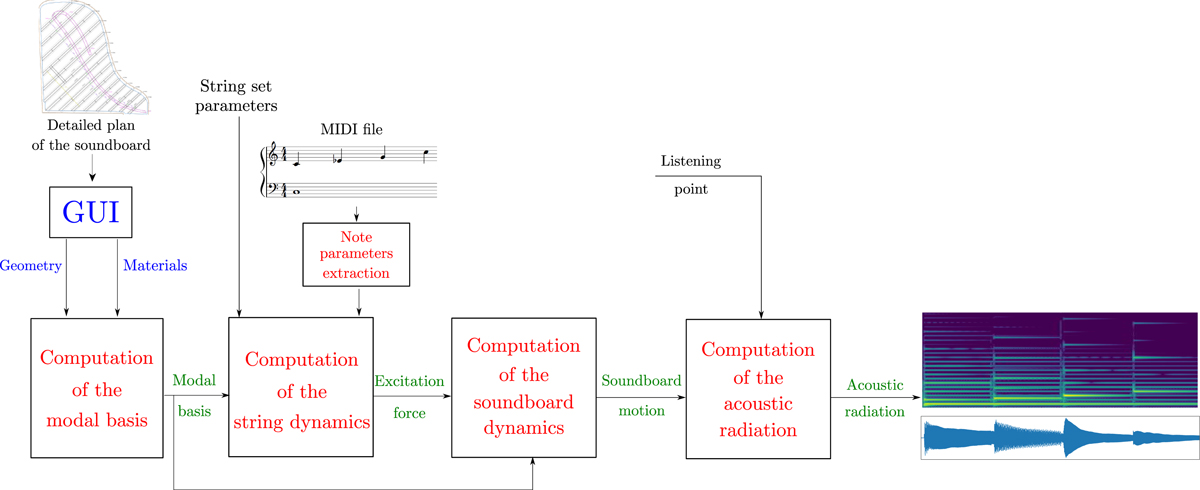
Block-diagram of the software architecture. The input data provided by the user are represented by a black font color. Blue corresponds to user data entered in the GUI. The software operations and the software outputs are represented by the red and green font colors, respectively.
Current usage metrics show cumulative count of Article Views (full-text article views including HTML views, PDF and ePub downloads, according to the available data) and Abstracts Views on Vision4Press platform.
Data correspond to usage on the plateform after 2015. The current usage metrics is available 48-96 hours after online publication and is updated daily on week days.
Initial download of the metrics may take a while.