Open Access
Figure 7
Download original image
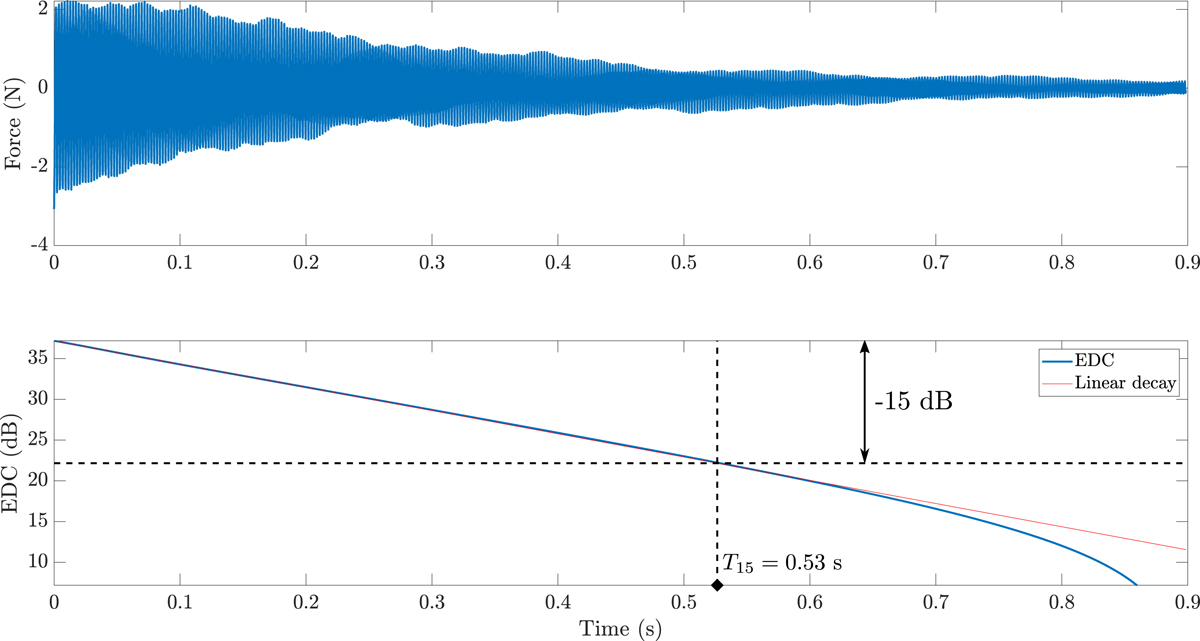
Example of energy decay curve (bottom) computed from the force applied by the A4 string to the soundboard of the reference piano (top). The linear part of the EDC (red solid line), obtained by linear interpolation, is used to compute the decay time T15.
Current usage metrics show cumulative count of Article Views (full-text article views including HTML views, PDF and ePub downloads, according to the available data) and Abstracts Views on Vision4Press platform.
Data correspond to usage on the plateform after 2015. The current usage metrics is available 48-96 hours after online publication and is updated daily on week days.
Initial download of the metrics may take a while.