Figure 4
Download original image
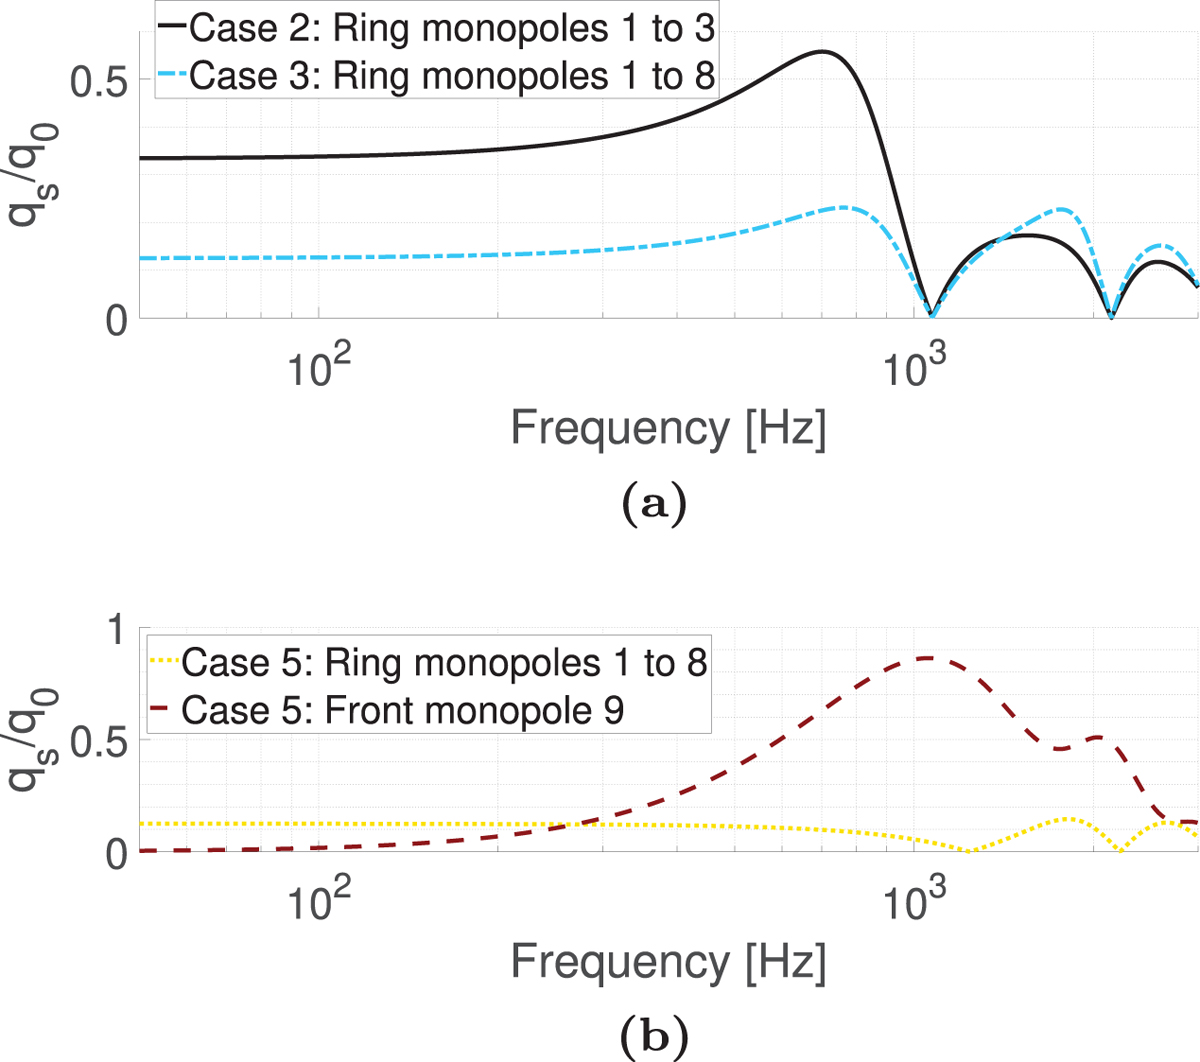
Volume velocity ratio ![]() with a monopole model for various cases presented in Figure 2. (a): the solid line represents each of the 3 secondary sources of the case 2 while the dashed and dotted one represents each of the 8 secondary sources for the case 3. (b): the dashed line represents the secondary source placed in front of the primary one and the dotted line represents each of the 8 secondary sources placed on the ring, both for case 5 without and with (same curves with circles) regularization with β = 200.
with a monopole model for various cases presented in Figure 2. (a): the solid line represents each of the 3 secondary sources of the case 2 while the dashed and dotted one represents each of the 8 secondary sources for the case 3. (b): the dashed line represents the secondary source placed in front of the primary one and the dotted line represents each of the 8 secondary sources placed on the ring, both for case 5 without and with (same curves with circles) regularization with β = 200.
Current usage metrics show cumulative count of Article Views (full-text article views including HTML views, PDF and ePub downloads, according to the available data) and Abstracts Views on Vision4Press platform.
Data correspond to usage on the plateform after 2015. The current usage metrics is available 48-96 hours after online publication and is updated daily on week days.
Initial download of the metrics may take a while.