Figure 3
Download original image
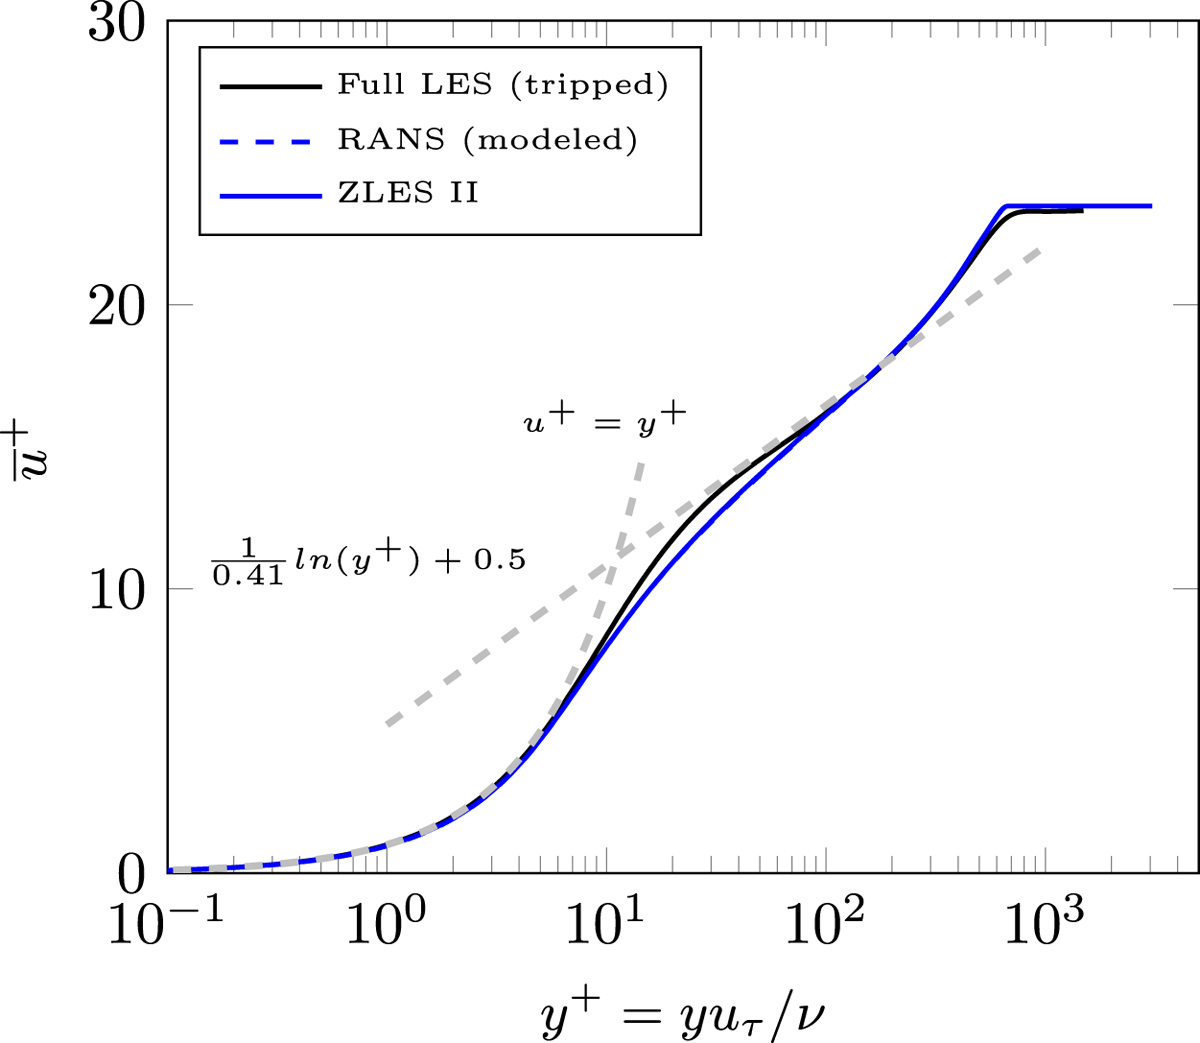
Comparison of the mean velocity profile between the full LES (tripped), the RANS simulation, and ZLES II (zonal LES based on the RANS simulation data) at the inflow of the zonal LES. The mean velocity profile of the RANS simulation and the ZLES are identical.
Current usage metrics show cumulative count of Article Views (full-text article views including HTML views, PDF and ePub downloads, according to the available data) and Abstracts Views on Vision4Press platform.
Data correspond to usage on the plateform after 2015. The current usage metrics is available 48-96 hours after online publication and is updated daily on week days.
Initial download of the metrics may take a while.