Figure 9
Download original image
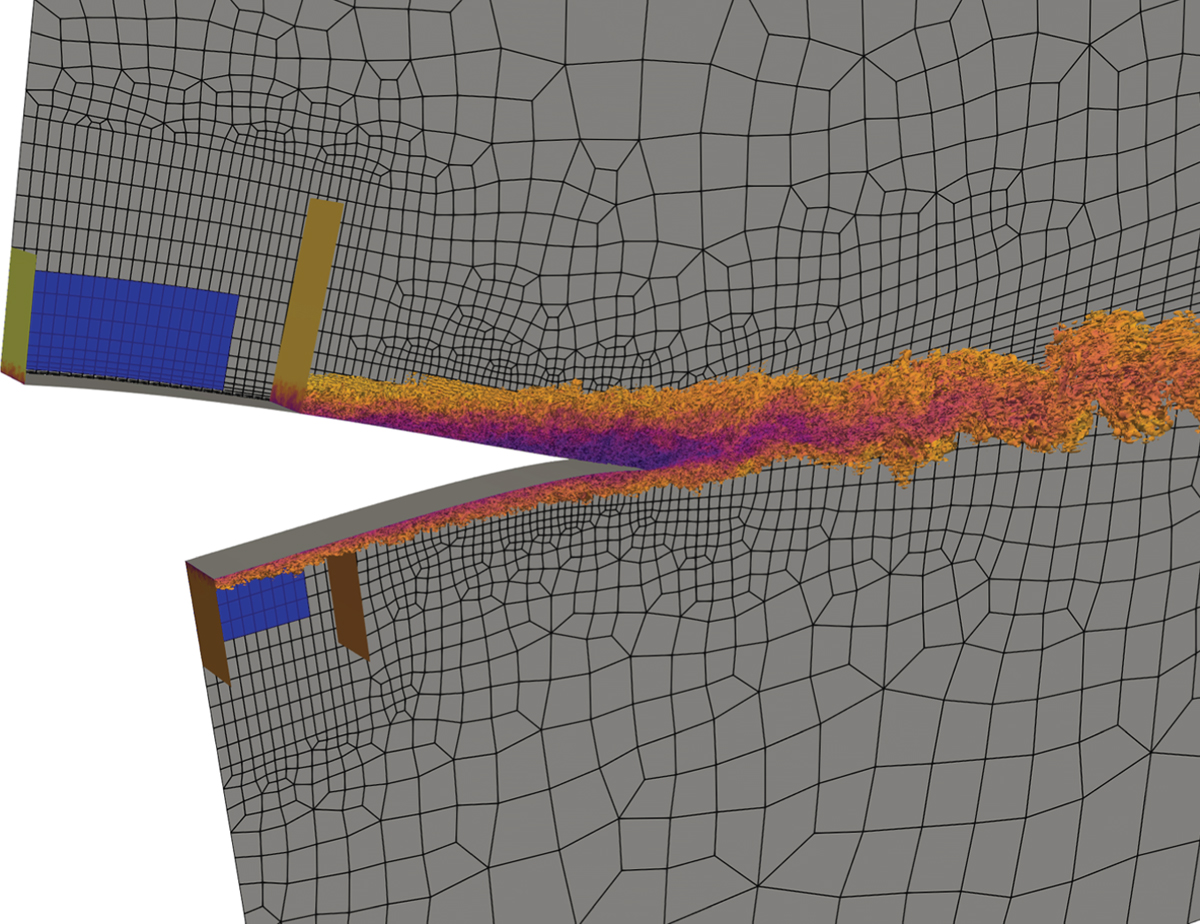
Trailing edge of the NACA 64418 airfoil. Vortex structure visualized by the Q-criterion (Q = 200) colored by the streamwise velocity in the range [−0.3, 1.3]. The displayed planes indicate the inflow and recycling planes. The forcing region is highlighted in blue.
Current usage metrics show cumulative count of Article Views (full-text article views including HTML views, PDF and ePub downloads, according to the available data) and Abstracts Views on Vision4Press platform.
Data correspond to usage on the plateform after 2015. The current usage metrics is available 48-96 hours after online publication and is updated daily on week days.
Initial download of the metrics may take a while.