Figure 10
Download original image
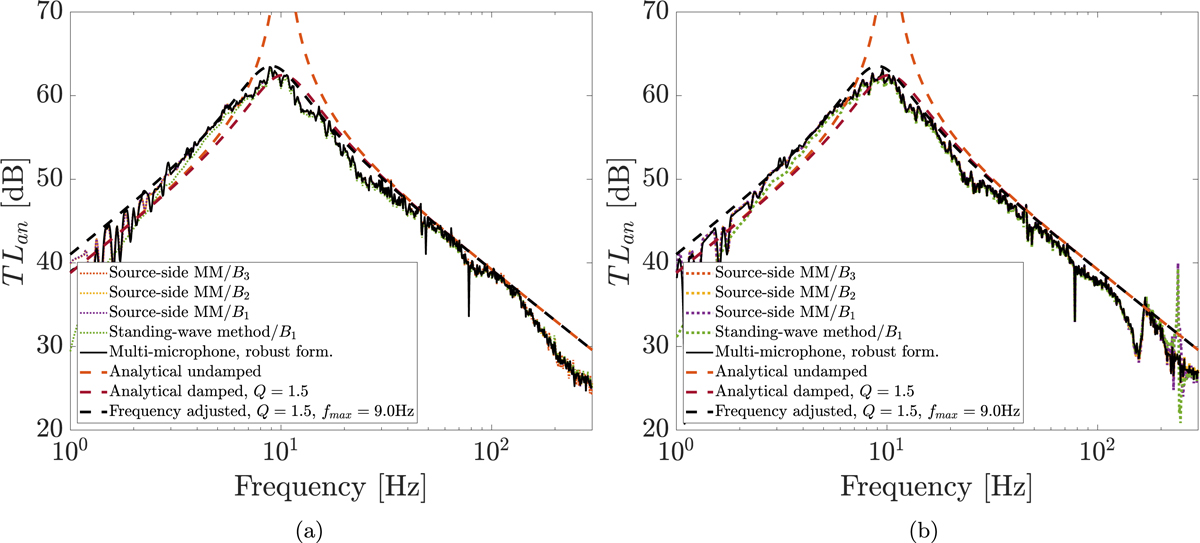
Comparison between measured TLan of the gas resonator with p0 = 3.4 bar and pf = 5.5 bar for the 20 m PU tube termination (a) and the closed-end termination (b) using the source-side multi-microphone method with robust formulation, the standing-wave method and the classic multi-microphone method with robust formulation. The measured TLan are compared to undamped analytical model, damped model with quality factor Q = 1.5 and an frequency adjusted TLan plot with Q = 1.5 and fmax = 9.0 Hz.
Current usage metrics show cumulative count of Article Views (full-text article views including HTML views, PDF and ePub downloads, according to the available data) and Abstracts Views on Vision4Press platform.
Data correspond to usage on the plateform after 2015. The current usage metrics is available 48-96 hours after online publication and is updated daily on week days.
Initial download of the metrics may take a while.