| Issue |
Acta Acust.
Volume 7, 2023
|
|
|---|---|---|
| Article Number | 51 | |
| Number of page(s) | 6 | |
| Section | Physical Acoustics | |
| DOI | https://doi.org/10.1051/aacus/2023039 | |
| Published online | 23 October 2023 | |
Scientific Article
Characteristics of partially filled Helmholtz resonators
1
Laboratoire OPTIMAG, UBO Brest, 6, av. Le Gorgeu, C.S. 93837, 29238 Brest, France
2
UBO Brest, CNRS, IRD, Ifremer, IUEM, Laboratoire d’Océanographie Physique et Spatiale (LOPS), Technopole Brest-Iroise, Rue Dumont d’Urville, 29280 Plouzané, France
* Corresponding author: This email address is being protected from spambots. You need JavaScript enabled to view it.
Received:
20
January
2023
Accepted:
1
August
2023
Abstract
In this work we have developed a technique for the measurement of the resonance curve of Helmholtz resonators as a function of filling with beads and sands of different sizes, and water as the reference. Our measurements allowed us to observe very different behaviors of resonance frequencies and resonance half-widths as a function of the size of the sand grains and the beads. By comparing results for beads and water we were able to prove that the sound penetrates the interstitial space between the beads. This was confirmed by measurements of the resonance properties in resonators filled with spherical beads whose experimentally determined filling factor is close to the random filling factor of about 0.54. The similar behavior of the frequency and half-width of resonance of sand-filled resonators of three different sizes allowed us to suggest that sound penetrates the sand in the same way as it does the beads.
Key words: Sound / Sound absorption / Helmholtz resonators / Granular matter / Sand
© The Author(s), Published by EDP Sciences, 2023
 This is an Open Access article distributed under the terms of the Creative Commons Attribution License (https://creativecommons.org/licenses/by/4.0), which permits unrestricted use, distribution, and reproduction in any medium, provided the original work is properly cited.
1 Introduction
The resonator invented by Helmholtz was originally intended for analyzing the tones of musical sound [1, 2]. Today the field of application of the acoustic Helmholtz resonator (HR) is very wide. The control of frequency properties such as the quality factor and the frequency of the resonance are important for a large number of applications in modern technology in various military and civil sectors. In architecture due to the concentration of population in urban areas, the use of absorbing structures to modify the architectural acoustics, the damping of low frequencies has proved to be a major objective [3].
To achieve the absorption of low frequencies due to noise pollution with the ongoing urban densification, textile resonators with multiple absorption mechanisms have been considered [4].
In oceanography, the concept of HR has been used to describe the dynamics of tidal elevation in a short, nearly enclosed basin that is connected to a tidal sea by a narrow strait [5, 6].
The HR help to explain the functioning of earthen vessels in medieval buildings (also known as acoustic vessels) which have been of interest to archaeologists and acousticians [7].
It is well-known that the resonance frequency shift can be used for measuring the volume of liquids in the resonator [8, 9]. HR is also used as a measuring device, as well as in the fabrication of sensors [10, 11]. Belluci et al. [12] analyzed the thermo-acoustic pulsations that occur in gas turbine combustion chambers and discussed the use of Helmholtz resonators to dampen the noise of these pulsations generated by rocket and aircraft engines.
Car manufacturers use Helmholtz resonance for noise suppression which is one of the components of environmental noise pollution [13]. Sometimes, new versatile materials like metamaterials are used for these purposes [14–16].
The main goal of our work is to study how partial fillings change the resonance properties of HR [8–10]. It is well-known that the basic frequency f0 of the HR can be changed in a controlled manner by filling it partially for example with water Figure 1.
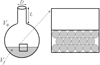 |
Figure 1 Schema of a partially filled Helmholtz resonator with characteristic parameters Vf, V0, L and D. Here V0 is the total volume of the empty resonator after subtracting the microphone and earphone volumes and Vf is filled volume. L is the length and D the diameter of the neck. The zoom shows a filing diagram with beads (see sand). |
One of the parameters on which the resonant frequency f0 depends is the volume of the resonator. The influence of the filled volume on the frequency can be determined from the following equation [17–19]:
 (1)
(1)
Here  is the cross section area of the cylindrical neck of HR, D is its diameter, V = V0 − Vf is the remaining free volume, V0 is the total volume of the empty resonator after microphone and earphone volumes have been subtracted and Vf is filled volume. The fixed positions of the earphone and microphone are located below the neck. Nevertheless, it should be noted that the influence of the position of the earphone and microphone inside was verified as having no significant influence on our results. This is due to the homogeneity of the acoustic resonance pressure field in the HR. The parameters of the resonator neck [20, 21]: the cross section area S and the length L, as well as the sound speed cair in air, do not depend on the filling.
After a preliminary study of the influence of water filling on the resonance properties of HR as a reference, we extended our study to the variations of f0 as a function of the filling level of the Helmholtz resonator by granular materials.
The paper is organized as following: In Section 2, we describe our technique of the acoustic resonance measurements; in Section 3, measurements of the resonant frequency and linewidth are presented, as well as a discussion of the relevance and impact of our experimental results; finally in Section 4, we outline the significance of the obtained results.
2 Experimental technique
In order to record the resonance curve the acoustic oscillations were excited by a small earphone put inside the HR. This technique excludes strong disturbing sound created when the resonance is excited by a loud speaker outside the resonator. The microphone registering the acoustic response is also placed inside the resonator.
Precise resonance curves were obtained using a small oscilloscope without screen, PicoScope 2204A, which was controlled by a PC using Python. The PicoScope has an intrinsic signal generator which excites the earphone Figure 2. A power amplifier was used because of too high intrinsic resistance (600 Ω) of the generator. The microphone is connected to the input A of the PicoScope via a preamplifier based on 2N-2222A triode. Its signal transmitted to PC is fitted by a sinusoidal curve having the generator frequency, so the exact amplitude of the acoustic signal is obtained even if the original signal is noisy. In addition to the amplitude, the acoustic phase could also be obtained by connecting the generator output G to the PicoScope input B the signal of which is fitted by a sinusoidal curve.
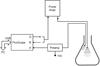 |
Figure 2 Schema of the measurements using the PicoScope. The microphone and PicoScope inputs are denoted by A and B respectively. The generator output is denoted by G. The microscope and earphone (represented by a rectangle) are inserted into the resonator. |
A highly accessible modification of the technique can be realized using a smartphone with phyphox application [22, 23] keeping practically the same measurement precision. The only drawback is the loss of phase information which is not used in the present work. A standard earphone with a microphone is connected directly to the smartphone and put inside the resonator (Fig. 2). The frequency sweep and acoustic response are obtained using an appropriate phyphox experiment. The obtained curves are saved and replotted using a Python code.
For all measurements in this paper a 100 cm3 Erlenmeyer flask (conical flusk) was used as the HR. The internal volume of the resonator V0 is about 115 cm3. The neck has a length L = 32 mm and a diameter D = 18 mm.
The resonance frequency of the empty resonator estimated by equation (1) is about 393 Hz (here the value of the sound speed in air cair = 343.5 m/s at 20 °C is used). Measurements using PicoScope give a somewhat lower value 351 Hz (see Fig. 3). The difference is due to a deviation from assumptions SL/V ≪1 and S/V2/3 ≪ 1 of equation (1) derivation (here SL/V = 0.07 and S/V2/3 = 0.11).
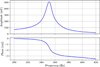 |
Figure 3 The resonance behavior of the acoustic amplitude and the phase in function of the excitation frequency demonstrates a close analogy of the Helmholtz resonator and a classical spring-mass oscillator. |
The acoustic resonance is very similar to the classical resonance of a mass on a spring. The resonance peak corresponds to the damping of the mass motion and the difference of the phase of acoustic pressure oscillations follows classical behavior: at low frequencies the excitation and the response are in-phase, at the resonance frequency the phase shift is 90° and at high frequencies the excitation and the response are anti-phase (Fig. 3).
Physically compressing–decompressing of air in the volume of the HR accompanied by air motion in the neck is an analogue of the mass-spring mechanical oscillator system: the spring corresponds to the volume of the gas in the resonator and the mechanical mass to the mass of moving air in the neck [17].
3 Experimental results and discussions
Before studying the variation of the resonator frequency as a function of the filling level with granular materials, we first measured the frequency behavior of the resonator as a function of the partial filling with water as a reference.
The resonance peak of our Erlenmeyer flask is gradually shifted to high frequencies upon filling with water (Fig. 4). Resonance peak is shifted from the left to the right with increasing the water volume Vf by step of about 5 cm3. The values of resonance frequencies were refined by fitting of 5 points at the top of each resonance peak by a parabola.
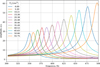 |
Figure 4 The evolution of the increasing acoustic resonance (from left to right) as a function of filling volume of the Helmholtz resonator with water Vf [8, 9]. |
Sound practically does not penetrate into water and the resonator acting volume V is the difference between its initial volume V0 and the water volume Vf. It is proved by a fitting of the experimental points by the function  with two fitting parameters a and V0 (Fig. 5), as seen from equation (1). Here we obtain V0 = 110 cm3 that is very close to our measured value of 115 cm3.
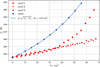 |
Figure 5 Resonance frequency f0 dependence on filled volume Vf for water (circles), sand 1 (squares) sand 2 (triangles) and sand 3 (by diamonds). |
Different results were obtained in the following measurements of resonant frequency as a function of partial filling of the resonator with three different sands, which we will call sand 1, sand 2 and sand 3 respectively. Rough estimation of grain size using an optical microscope gives the following values: 0.2 ± 0.1 mm, 0.4 ± 0.2 mm and about 1.1 ± 0.5, as shown in Figure 6 at the same scale. The formation of sand grains by the decomposition of pre-existing rocks through weathering and erosion leads to a significant fluctuation in the size of these grains [24]. The volume of sand in successive additions was controlled by their weight, with milligram precision. For the various fillings, the resonator was neither emptied nor cleaned, the microphone and earphone remaining fixed. Sand was added using a special tube to avoid contamination of the measuring instruments, and then the resonator was gently shaken to obtain a flat surface. The addition of sand through a tube limited air contamination by dust.
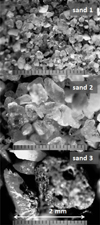 |
Figure 6 The grain sizes of sand 1, sand 2 and sand 3 are roughly estimated, on the basis of optical microscope images of the same scale, to be about 0.2 ± 0.1 mm, 0.4 ± 0.2 mm and 1.1 ± 0.5 respectively. |
The resonance curves of these sands have the same frequency evolution as a function of the filling volume up to 30 cm3 as seen in Figure 5. From this frequency, the evolution of sand 1 changes its quasi-linear behavior and becomes nonlinear similar to that of water. For comparison, we see in Figure 5 the frequency behavior of water as a function of the filling volume which follows perfectly the theoretical predictions described by equation (1) [17, 19]. Note that the samples sands 2 and 3 continue to have a quasi-linear behavior up to the maximum filling volumes of 70 cm3.
These differences in behavior between sands 2, 3 and sand 1 are even more pronounced in the trends of the resonance half-widths as a function of the filling volume as shown in Figure 7.
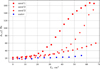 |
Figure 7 Resonance half-width Δ1/2f dependence on filled volume Vf for water (circles), sand 1 (squares) sand 2 (triangles) and sand 3 (by diamonds). |
The measurements of the half-widths of resonance as a function of the volume of filling demonstrate clear difference between the dependencies of the water and the three sands. The half-widths of three sands of different sizes increase gradually up to value Vf =20 cm3 with a slope about the same than that of the water. Then a distinct upturn occurs for the sand 1 with the fastest growth that comes to a saturation at about Vf = 60 cm3. Sand 2 follows the same type of deviation from the quasi-linear behavior of water with an upturn at Vf = 35 cm3. The behavior of sand 3 is clearly different from that of water but has a slower evolution than sand 1 and sand 2. The significant deviation of the behavior of the resonance frequency and the resonance half-width of three sands as a function of Vf from that of water makes us believe that there is a penetration of sound into the interstitial volume between the sand grains.
To better understand these differences in the behavior of three sands, and to be able to assert the hypothesis of the penetration of sound in the sand we decided to study two types of spherical beads of different well-defined diameters and different densities. Obviously, the packing factor has a great importance in this problem. The packing factors of the sands are difficult to evaluate since they contain grains of different sizes and of very irregular shapes. For large diameter spherical beads (d = 5.92 mm), the packing factor can be exactly determined experimentally since they can be easily counted.
For this purpose, we have compared in Figure 8 the behavior of the resonant frequency of the resonator filled with water and with spherical beads of two different sizes. From now on, we will call beads 1, the ones of diameter d1 = 5.92 ± 0.01 mm and beads 2 the ones of diameter d2 = 0.9 ± 0.1 mm.
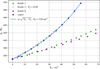 |
Figure 8 Resonance frequency f0 dependence on filled volume for water (circles), beads 1 (big triangles), beads 2 (diamonds). Small triangles show the data for the beads renormalized to their proper volume Vf × 0.53 (the renormalization coefficient 0.53 corresponds to the loose random packing factor of spheres). |
As can be seen in Figure 8, beads 1 and 2 of different sizes have similar behavior. The evolution of the frequency as a function of Vf for beads 2 deviates slightly more from the behavior of water. We must distinguish two volumes that can be measured experimentally. The volume Vf designates the total volume occupied by all the beads (1 or 2).
For example 375 balls of diameter 5.92 mm occupy a volume of Vf =76 cm3 in the experimental test tube. Each spherical bead has its own volume. By adding up the volumes of all the beads, one gets the proper volume that all the beads have together. This volume differs from Vf by a coefficient that is called the packing factor, which characterizes the density and compactness of the packing of these spheres. Taking into account that the volume of a single bead is 0.109 cm3, the 375 beads have a total proper volume of 40.7 cm3. The packing factor will then be equal to ratio of these two volumes 0.536 = 40.7/76. The way that the beads were introduced into the HR leads us to believe that the resulting packing can be considered as loose random packing. The loose random packing factor is well-known and has been was calculated and observed experimentally for single size spherical beads in a number of works [25–29].
Taking into account the loose random packing factor and correcting the filling volume by this factor we see that the behavior of the resonance frequency as a function of the proper volume of all beads is almost identical with that of water.
In Figure 9, we see that the half-widths of resonance of the two beads of different sizes increase more rapidly than the half-width of resonance of the water. The evolution of half-width of resonance of the water and of big beads (beads 1) as a function of Vf are quasi-linear. The curve of half-width of resonances of the small beads 2 is superior to that of the water and beads 1 and undergoes a fast growth starting from Vf = 40 cm3, which approaches the behavior of sand 2 and 3 (see Fig. 7) remaining between these two curves. It is worth noting that the size of the beads 2 is larger than that of the sand 2 and smaller than that of the sand 3. The fact that the half-widths of resonance of the two beads is above the water curve is explained by the fact that there is damping of the sound in the interstitial channels between the beads. This statement is justified by the observation that the damping is greater for small beads because the corresponding interstitial channels are thinner [30–32].
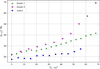 |
Figure 9 Resonance half-width Δ1/2f dependence on filled volume Vf for water (circles), beads 1 (triangle), beads 2 (diamonds). |
4 Conclusions
Based on our measurement technique we have shown in this work that the study of the resonance half-width is more sensitive to the processes of sound penetration into the filling substance and damping of sound oscillations than the corresponding behavior of the resonance peak.
Our observations of the frequency and the half-width of the resonance peak as a function of water filling are consistent with well-known results and confirm the non-penetration of sound oscillations in the latter.
The properties of the resonance with sand filling are much less known and understood. The increase of the resonance frequency as a function of the amount of sand is much less important than that of water and initially has an almost linear course. More interestingly, for sand with small grains (sand 1) a rapid increase of the resonance frequency following the behavior of water is observed. The sands of larger size continue to increase with their initial trend without notable differences.
More varied trends are observed on the resonance half-width curves. The curves of three sands with three different sizes are distinct. The sand with the smallest grains shows an upturn in the curve at low fillings. We observe this tendency for the two other sands with the upturns depending on their size.
One observes with the beads of different size also weaker increase of resonance frequency compared to water. The measurement of the packing factor of the beads and the comparison with the resonance behavior of water shows that this small increase in resonance frequency of the beads is related to the total penetration of the sound in the interstitial space between the beads. This penetration becomes even more obvious in the behavior of the resonance half-width as a function of partial filling. For smaller beads, narrow interstitial channels favor the increase of viscous damping and therefore resonance half-width.
This analysis shows that a similar sound penetration into the interstitial space in the sands is responsible for both the small increase in resonant frequency related to the packing factor and for the very specific behavior of the resonance half-width curves controlled by the viscous damping.
Conflicts of interest
The authors declare that they have no conflicts of interest in relation to this article.
Data availability statement
The research data associated with this article are included within the article.
Acknowledgments
Authors thank Olivier Roux for technical assistance.
References
- H. Helmholtz, H. Margenau, A.J. Ellis: On the sensations of tone as a physical basis for the theory of music, Dover, New York. 1954. [Google Scholar]
- H.G. Dosch, M. Hauck: The helmholtz resonator revisited. European Journal of Physics 39 (2018) 055801. [CrossRef] [Google Scholar]
- J.P. Arenas, M.J. Crocker: Recent trends in porous sound-absorbing materials. Sound & Vibration 44 (2010) 12–18. [Google Scholar]
- K. Neuwerk, M. Haupt, G.T. Gresser: Sound absorption by textile resonators. Vibroengineering PROCEDIA 31 (2020) 103–108. [CrossRef] [Google Scholar]
- J.W. Miles, Y.K. Lee: Helmholtz resonance of harbours. Journal of Fluid Mechanics 67 (1975) 445–464. [CrossRef] [Google Scholar]
- A. Doelman, A.F. Koenderink, L.R.M. Maas: Quasi-periodically forced nonlinear helmholtz oscillators. Physica D: Nonlinear Phenomena 164 (2002) 1–27. [CrossRef] [Google Scholar]
- G.W. Minns: Acoustic pottery. Norfolk Archaeology 7 (2020) 92–101. [Google Scholar]
- A. Nakano, Y. Torikata, T. Yamashita, T. Sakamoto, Y. Futaya, A. Tateno, T. Nishizu: Liquid volume measurement with a closed helmholtz resonator under micro-gravity conditions. Cryogenics 46 (2006) 126–131. [CrossRef] [Google Scholar]
- E.S. Webster, C.E. Davies: The use of helmholtz resonance for measuring the volume of liquids and solids. Sensors 10 (2010) 10663–10672. [CrossRef] [PubMed] [Google Scholar]
- T. Nishizu, Y. Ikeda, Y. Torikata, S. Manmoto, T. Umehara, T. Mizukami: Automatic, continuous food volume measurement with a helmholtz resonator. Agricultural Engineering International: The CIGR E-Journal 3 (2001) 1–10. [Google Scholar]
- G.D. Metcalfe, S. Alahmari, ThW Smith, M. Hippler: Cavity-enhanced raman and helmholtz resonator photoacoustic spectroscopy to monitor the mixed sugar metabolism of E. coli. Analytical Chemistry 91 (2019) 13096–13104. [CrossRef] [PubMed] [Google Scholar]
- V. Bellucci, P. Flohr, C.O. Paschereit, F. Magni: On the use of helmholtz resonators for damping acoustic pulsations in industrial gas turbines. Journal of Engineering for Gas Turbines and Power 126 (2004) 271–275. [CrossRef] [Google Scholar]
- T. Yasuda, Ch Wu, N. Nakagawa, K. Nagamura: Studies on an automobile muffler with the acoustic characteristic of low-pass filter and Helmholtz resonator. Applied Acoustics 74 (2013) 49–57. [CrossRef] [Google Scholar]
- R. Hedayati, S. Lakshmanan: Pneumatically actuated acoustic metamaterials based on helmholtz resonators. Materials 13 (2020) 1456. [CrossRef] [PubMed] [Google Scholar]
- K. Mahesh, R.S. Mini: Helmholtz resonator based metamaterials for sound manipulation. Journal of Physics: Conference Series 1355 (2019) 012031. [CrossRef] [Google Scholar]
- T. Yamamoto: Acoustic metamaterial plate embedded with helmholtz resonators for extraordinary sound transmission loss. Journal of Applied Physics 123 (2018) 215110. [CrossRef] [Google Scholar]
- L.E. Kinsler, A.R. Frey, A.B. Coppens, J.V. Sanders: Fundamentals of acoustics, 4th edn., Wiley, New York, 2000. [Google Scholar]
- Ph-M Morse, K.U. Ingard: Theoretical acoustics. McGraw-Hill, New York, 1968. [Google Scholar]
- ChA Greene IV, F.T. Argo, P.S. Wilson: A Helmholtz resonator experiment for the listen up project. In: Acoustical Society of America, Ed., Proceedings of Meetings on Acoustics, vol. 5, Acoustical Society of America, Miami, Florida. 2009, p. 025001. [Google Scholar]
- R.C. Chanaud: Effects of geometry on the resonance frequency of helmholtz resonators. Journal of Sound and Vibration 178 (1994) 337–348. [CrossRef] [Google Scholar]
- J.-F. Mercier, J.-J. Marigo, A. Maurel: Influence of the neck shape for helmholtz resonators. The Journal of the Acoustical Society of America 142 (2017) 3703–3714. [CrossRef] [PubMed] [Google Scholar]
- S. Staacks, S. Hiitz, H. Heinke, C. Stampfer: Advanced tools for smartphone-based experiments: phyphox. Physics Education 53 (2018) 045009. [CrossRef] [Google Scholar]
- Ch Stampfer, H. Heinke, S. Staacks: A lab in the pocket. Nature Reviews Materials 5 (2020) 169–170. [CrossRef] [Google Scholar]
- G. Nichols: Sedimentology and stratigraphy, 2nd edn., Wiley-Blackwell, Chichester, UK, 2009. [Google Scholar]
- Ch Song, P. Wang, H.A. Makse: A phase diagram for jammed matter. Nature 453 (2008) 629–632. [CrossRef] [PubMed] [Google Scholar]
- S. Torquato, F.H. Stillinger: Jammed hard-particle packings: From kepler to bernal and beyond/ Reviews of Modern Physics 82 (2010) 2633–2672. [CrossRef] [Google Scholar]
- G.R. Farrell, K.M. Martini, N. Menon: Loose packings of frictional spheres. Soft Matter 6 (2010) 29252930. [CrossRef] [Google Scholar]
- M.G. Jefferies: Nor-sand: a simle critical state model for sand. Geotechnique 43 (1993) 91–103. [CrossRef] [Google Scholar]
- K.P. Panayiotopoulos: Packing of sands – a review. Soil and Tillage Research 13 (1989) 101–121. [CrossRef] [Google Scholar]
- P. Leclaire, L. Kelders, W. Lauriks, C. Glorieux, J. Thoen: Determination of the viscous characteristic length in air-filled porous materials by ultrasonic attenuation measurements. The Journal of the Acoustical Society of America 99 (1996) 1944–1948. [CrossRef] [Google Scholar]
- J.-F. Allard, N. Atalla: Propagation of sound in porous media: modelling sound absorbing materials, 2nd edn., Wiley, New-York, 2009. [CrossRef] [Google Scholar]
- D.L. Johnson, J. Koplik, R. Dashen: Theory of dynamic permeability and tortuosity in fluid-saturated porous media. Journal of Fluid Mechanics 176 (1987) 379–402. [Google Scholar]
Cite this article as: Indenbom MV & Pogossian SP. 2023. Characteristics of partially filled Helmholtz resonators. Acta Acustica, 7, 51.
All Figures
|
Figure 1 Schema of a partially filled Helmholtz resonator with characteristic parameters Vf, V0, L and D. Here V0 is the total volume of the empty resonator after subtracting the microphone and earphone volumes and Vf is filled volume. L is the length and D the diameter of the neck. The zoom shows a filing diagram with beads (see sand). |
| In the text | |
|
Figure 2 Schema of the measurements using the PicoScope. The microphone and PicoScope inputs are denoted by A and B respectively. The generator output is denoted by G. The microscope and earphone (represented by a rectangle) are inserted into the resonator. |
| In the text | |
|
Figure 3 The resonance behavior of the acoustic amplitude and the phase in function of the excitation frequency demonstrates a close analogy of the Helmholtz resonator and a classical spring-mass oscillator. |
| In the text | |
|
Figure 4 The evolution of the increasing acoustic resonance (from left to right) as a function of filling volume of the Helmholtz resonator with water Vf [8, 9]. |
| In the text | |
|
Figure 5 Resonance frequency f0 dependence on filled volume Vf for water (circles), sand 1 (squares) sand 2 (triangles) and sand 3 (by diamonds). |
| In the text | |
|
Figure 6 The grain sizes of sand 1, sand 2 and sand 3 are roughly estimated, on the basis of optical microscope images of the same scale, to be about 0.2 ± 0.1 mm, 0.4 ± 0.2 mm and 1.1 ± 0.5 respectively. |
| In the text | |
|
Figure 7 Resonance half-width Δ1/2f dependence on filled volume Vf for water (circles), sand 1 (squares) sand 2 (triangles) and sand 3 (by diamonds). |
| In the text | |
|
Figure 8 Resonance frequency f0 dependence on filled volume for water (circles), beads 1 (big triangles), beads 2 (diamonds). Small triangles show the data for the beads renormalized to their proper volume Vf × 0.53 (the renormalization coefficient 0.53 corresponds to the loose random packing factor of spheres). |
| In the text | |
|
Figure 9 Resonance half-width Δ1/2f dependence on filled volume Vf for water (circles), beads 1 (triangle), beads 2 (diamonds). |
| In the text | |
Current usage metrics show cumulative count of Article Views (full-text article views including HTML views, PDF and ePub downloads, according to the available data) and Abstracts Views on Vision4Press platform.
Data correspond to usage on the plateform after 2015. The current usage metrics is available 48-96 hours after online publication and is updated daily on week days.
Initial download of the metrics may take a while.