| Issue |
Acta Acust.
Volume 7, 2023
|
|
|---|---|---|
| Article Number | 1 | |
| Number of page(s) | 9 | |
| Section | Active Control | |
| DOI | https://doi.org/10.1051/aacus/2022060 | |
| Published online | 09 January 2023 | |
Scientific Article
Investigation of an engine order noise cancellation system in a super sports car
1
Department of Mechanical Engineering, Politecnico di Milano, 20156 Milano, Italy
2
Institute of Sound and Vibration Research, University of Southampton, SO17 1BJ Southampton, UK
3
Whole vehicle NVH Department, Automobili Lamborghini S.p.A., 40019, Sant’Agata Bolognese (BO), Italy
* Corresponding author: This email address is being protected from spambots. You need JavaScript enabled to view it.
Received:
30
August
2022
Accepted:
2
December
2022
Abstract
Today’s cars must meet ever-higher acoustic standards, and so, to avoid compromising vehicle dynamics, handling performance and fuel consumption, standard passive methods alone do not provide sufficient performance. Active control solutions can provide a potential solution to this challenge, particularly at low frequency and such systems have been investigated for application to small cars, SUVs and luxury vehicles. These vehicles are generally characterised by fairly slow dynamics and limited noise emission and, therefore, this paper explores the challenging application of active noise control to a two-seat super sports car equipped with a naturally aspirated engine. This work aims to track and then control sounds characterised by extremely rapid frequency variation rates, up to peaks of over 80 Hz/s, and high sound pressure levels. A multi-channel, multi-order FxLMS based control system has been implemented, which has been modified to optimise performance for this application by including both convergence gain and leakage scheduling, to achieve effective control at the driver’s and passenger’s ears. To evaluate the performance of the controller, its performance has been simulated when applied to measurements taken under several vehicle manoeuvres, ranging from conventional constant engine speed to very fast engine run-ups. From the presented results, it is shown that the system can obtain high levels of control during the manoeuvre set, with the controller reducing the overall sound pressure level by more than 10 dB at certain frequencies when analysing a single order, and it reduces the overall loudness by around 5% in all of the analysed cases.
Key words: Active noise control / Adaptive control / LMS / Supersports car sound
© The Author(s), Published by EDP Sciences, 2023
 This is an Open Access article distributed under the terms of the Creative Commons Attribution License (https://creativecommons.org/licenses/by/4.0), which permits unrestricted use, distribution, and reproduction in any medium, provided the original work is properly cited.
1 Introduction
Active noise control systems are effective and efficient at low frequencies, where traditional passive methods fail or where such passive treatments would require dimensions and weights that would compromise the performance of the system to which they are being applied. In essence, active solutions act on the system by creating a secondary excitation equal in magnitude and opposite in phase to the unwanted disturbance at particular locations so that cancellation is achieved via destructive interference [1–3].
Active control has been shown to be beneficial in a variety of applications where acoustic control is critical [4, 5], including trains [6] and aeroplanes using both acoustic and non-acoustic actuators [7, 8]. In the nautical field, several applications have been implemented in the last few years – one example is given in the work of Cheer and Elliott [9] where the low frequency noise produced by a diesel generator has been reduced by several decibels in the master cabin of a luxury yacht. It is possible to find a multitude of different applications that exploit active control technologies in order to reduce and modify the sound field: for example, active control has been applied to reduce: the noise produced by a fan [10], the narrowband noise generated by the propellers of an aircraft [11], the acoustic excitation generated by a helicopter transmission [12], the noise in a tractor cabin [13], or general environmental noise experienced when wearing headphones [14]. Active control systems have attracted a lot of interest and attention in the automotive field as they do not require the addition of heavy or bulky materials that would compromise the performance and fuel consumption of the car [15–17]. Research in this area has focused on two issues: control of engine-generated noise [18–20], i.e. a tonal disturbance, and control of tyre rolling noise, i.e. a broadband disturbance [21–23].
This paper focuses on the design and numerical simulation of a multi-channel, multi-tonal adaptive control system designed to control the sound generated by a naturally aspirated engine of a 2-seat super sports car at the driver’s and passenger’s ears. So far, noise attenuation activities in the automotive industry have focused on small cars [18, 20, 24], SUVs [19] and other premium luxury vehicles [25]; however, this work is one of the first attempts published in the open literature to reduce the noise produced by the engine of a super sports car. This presents a particular challenge due to the high dynamic nature of the super sports car, particularly compared to the small cars, SUVs and luxury vehicles that have been the application focus for the majority of previous applications of engine ANC systems. This paper therefore presents a new case study that addresses the challenge of controlling engine orders with variable-frequencies with acceleration rates ranging between, over 80 Hz/s and 8 Hz/s. Moreover, the acoustic field to be controlled is characterised by engine orders with amplitudes over 90 dB, which puts significant requirements on the loudspeaker used for control. To overcome these two challenges, which are quite specific to the super sports car application, this paper uses both convergence gain and leakage scheduling. To this end, the stability and performance of the controller are not only investigated under one simple manoeuvre, but under several manoeuvres carried out in different gears and under different rates of acceleration. The investigated manoeuvres have been identified to provide a selection of conditions that represent a complete range of driving scenarios under which the controller may be required to operate.
The paper is structured as follows: in Section 2 the system configuration is described. In Section 3 the set of vehicle manoeuvres is analysed. Section 4 describes the feedforward active noise control algorithm, and Section 5 presents simulation results highlighting its performance and stability. Lastly, Section 6 closes with conclusions.
2 Control system configuration
This section will initially describe the configuration of the active sound control system inside the cabin of a 2-seat super sports car. As previously mentioned in Section 1, the control system uses 4 error microphones, with two positioned at each of the headrests, as shown in Figures 1 and 2. The actuation system, which is shown in Figure 1, is composed of 4 loudspeakers, including 2 woofers (8 inches) housed in the doors in the area between the floor and the dashboard, and 2 tweeters (2 inches) positioned on the side of the dashboard, close to the A-pillars. The reference signal is a non-acoustic signal provided by the CAN bus (Controller Area Network), which provides the control algorithm with a digital signal corresponding to the engine speed. As a result there is no acoustic feedback to the reference signal to consider in the design of the controller [2, 3]. The block diagram of the control system is shown in Figure 2, indicating the five inputs to the controller – including the four headrest microphone error signals and the engine speed signal provided by the CAN bus – and the four outputs from the controller that drive the loudspeakers in order to control the sound field within the car cabin.
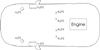 |
Figure 1 Actual scheme and positioning of the control system (microphones and loudspeakers) in the car cabin. |
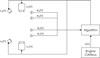 |
Figure 2 Block diagram of the ANC system highlighting the direction of the data flow in the control system. |
As noted above, two different types of loudspeakers have been used to implement control, including both door-mounted woofers and dash-mounted tweeters. Therefore, it is interesting to study the frequency responses of the different control sources and Figure 3 shows the plant responses between an error microphone and the two different types of loudspeakers. From these results it can be observed that over the presented frequency range the response of the woofer is quite flat, with some cabin modes observable at frequencies below around 300 Hz, but at higher frequencies the modal density and damping both increase and this leads to a relatively flat response. On the contrary, the response corresponding to the tweeter shows that it is less capable at lower frequencies, as expected, where ANC systems are more effective. Below 100 Hz, the response is lower than the noise floor of the measurement setup, but as frequency increases the output from the tweeter begins to increase until it reaches full strength at around 700 Hz. It is still less sensitive at the upper limits of the presented frequency range than the woofer, however, two tweeters are still included in the system since they improve the control performance in terms of the measured loudness.
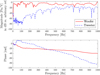 |
Figure 3 Plant responses between one woofer (solid line) and one tweeter (dashed line) and one of the error microphones at the headrest. |
3 Vehicle manoeuvres
Previously published research on engine order cancellation has typically focused on a limited range of vehicle manoeuvres, often simply demonstrating performance on a single Wide-Open Throttle (WOT) condition in a single gear. To provide broader insight, this paper investigates the performance of the active control system for a larger set of manoeuvres, which is particularly relevant owing to the dynamic nature of the super sports car being investigated. The considered manoeuvres not only include the WOT manoeuvre in both high and low gears, but also a Partial-Open Throttle (POT) manoeuvre, and a constant speed manoeuvre.
The WOT condition is a ramp up at full throttle – 100% throttle opening – in a constant gear from the minimum rpm to the maximum allowed by the gear. The POT is also a ramp up from minimum to maximum rpm in a single gear, but the throttle is only open about 50%. Clearly, the POT manoeuvre will be slower compared to the WOT manoeuvre, but it will be more difficult to repeat and replicate. Lastly, the constant speed manoeuvre consists of maintaining the same speed, and therefore, the same engine rotation, for a period of time. Through this set of manoeuvres it is possible to reliably characterise the vehicle, covering both steady manoeuvres and dynamic ones, with both fast and slow accelerations which are typical of super sports cars. Although a deceleration condition may be included to fully characterise the vehicle driving conditions, the engine orders are no longer dominant under such conditions and, therefore, the engine order cancellation is not applicable under this condition.
Figure 4 shows the change in engine speed over time for the five different manoeuvres. In each case the duration of the manoeuvre is normalised to the duration of the WOT in the main gear, which is equal to 10.5 s. From this plot the different rates of engine speed increase for the analysed manoeuvres can be seen. The main gear WOT is characterised by a linear growth in the rotational speed of the engine that presents a good trade-off between representing the behaviour of the car and testing the performance of the control algorithm. However, in order to test the performance limits of the control algorithm, a faster ramp up has also been provided by the low-gear WOT, while slower run ups have been provided by the POT in the main gear, and by the WOT in a high gear.
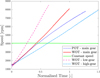 |
Figure 4 Comparison of the engine speed time histories of the analysed manoeuvres. |
Having described the different vehicle manoeuvres, the associated noise control problem will now be demonstrated initially via analysis of the WOT manoeuvre in the main gear. Figure 5 shows the spectrogram of the sound pressure level at one of the headrest microphones recorded during the WOT manoeuvre in the main gear – other microphones sense analogous sound fields. On the x-axis, as previously explained, the time has been normalised according to the duration of the main-gear WOT manoeuvre, so in this case it spans exactly from 0 to 1. The y-axis represents the frequency, and the colour of the spectrogram provides the amplitude of the sound pressure level, which is plotted with respect to an arbitrary reference level. Figure 5 shows that the spectrum is characterised by a considerable number of tonal components throughout the manoeuvre. These tonal components correspond to engine orders, and it can be seen that not only are the integer multiples of the principal engine rotational speed, but also the non-integer orders, albeit with a lower amplitude.
 |
Figure 5 Normalised spectrogram of the sound pressure level measured at one of the headrest microphones during the WOT manoeuvre in the main gear. |
In the right plots of Figure 6, the spectrograms referring to the WOT performed in the low and high gear are shown respectively. From the graphs, it can be seen that the excitation during the two tests is comparable, i.e., it is mainly marked by the engine orders especially towards the end of the ramp-up. The biggest difference, as already noted, is the duration: the high-gear manoeuvre lasts almost three times as long as that in low gear. The algorithm will therefore have significantly different control adaptation times. The top left plot of Figure 6 shows the spectrogram measured during a POT manoeuvre. This manoeuvre is also characterised by tonal components due to the engine orders, although with a lower amplitude as the engine load is lower – the throttle valve is only open to 50%. It can be seen that the frequency trend of the orders does not increase linearly over time as is the case with the WOT manoeuvres. Finally, the spectrogram obtained during a constant speed manoeuvre is shown in the bottom left plot of Figure 6. The latter is also characterised by the engine orders that are constant in time, but of significantly less amplitude than the other manoeuvres.
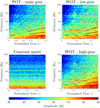 |
Figure 6 Normalised spectrogram of the sound pressure level measured at one of the headrest microphones during the POT manoeuvre in the main gear. |
This analysis demonstrates the specific challenge associated with controlling the noise generated by the naturally-aspirated super sports car, which clearly requires multiple engine orders to be tracked and controlled. It is also clear that the sound measured at the headrest is dominated by the engine orders during the presented manoeuvres and this motivates the particular choice of control algorithm described in the following section. In this work, it has been chosen to control four orders characterised by the highest noise emission due to the engine architecture and the number of cylinders. In this work, the 1.5th, 2.5th, 4th and 5th orders have been selected.
4 Control algorithm
In order to address the engine noise control challenge as described by the results presented in Figure 6, it is necessary to develop a controller that is able to control multiple engine orders. Since the noise corresponding to the engine orders can be directly predicted from the engine speed, and an engine speed reference signal is available, it is possible to use a feedforward controller. As explained in [3], the Fx-LMS algorithm, i.e., filtered reference least mean squares, is the most widely used algorithm for problems of this type. The first appearance of this algorithm was in the 1980s [26], and since then numerous variations have been made to improve and customise its performance to suit specific problems. Some examples of the most used variations can be found in [27, 28]. As quoted in the introduction, those algorithms have been employed in several fields in a variety of applications [3, 4, 16].
Figure 7 shows the block diagram proposed by Kuo and Morgan [2] that can be used to control a single frequency using a tachometer-based reference signal. The vector of error signals, that the controller aims to minimise, is represented by e in the block diagram; d denotes the vector of disturbance signals, i.e., the engine sound to be reduced plus additional noise in the surroundings, such as road noise; u represents the vector of control signals generated by the control algorithm; x denotes the input reference signal, i.e., the engine speed signal provided by the CAN bus data. The matrix of filtered reference signals is denoted by R, G is the matrix of the actual plant responses between the control sources and the error sensors, while  represents a model of these plant responses. The control filters are denoted by W. In this case, the plant response model,
  , uses 256-coefficient FIR filters to approximate the transfer functions between the control loudspeakers and the error microphones. This length has been set to provide a trade-off between an accurate approximation of the responses and a low computational load. To model the plant responses of the controller, it is possible to use a two-coefficient filter that is updated to track the input frequency. However, it is more straightforward to use a fixed broadband filter and therefore a constant 256-coefficient filter has been chosen.
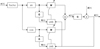 |
Figure 7 Block diagram of the single-frequency Fx-LMS algorithm. |
The single frequency Fx-LMS algorithm has been extended here to realise control of multiple engine orders. This is achieved by creating a set of four parallel algorithms that start from the same input – the engine speed – with each control algorithm tuned to minimise the contribution from one of the four selected engine orders. In other words, each algorithm works independently of the others. The frequency of the engine order to be controlled is first estimated from the tachometer-based reference signal and then the individual algorithm adapts the control filter coefficients to reduce minimise the error signal associated with the engine order under consideration using the LMS approach. The control filter in each case uses 2 coefficients per channel, so there is a total of 16 coefficients per engine order. Finally, the control signals generated by each of the parallel adaptive algorithms are summed to generate the 4 signals to drive the loudspeakers.
Since the multi-tonal controller is realised via a set of parallel single-frequency controllers, the single frequency controller will be described in more detail as follows. The control filter weights for the single-frequency multichannel controller are adapted according to the update equation
 (1)where w is the vector of control filter coefficients and α is the convergence step size. To improve the convergence and to limit both the power and frequency range over which the system operates to avoid divergence and damage to the loudspeakers, the Fx-LMS algorithm has been modified here in comparison to the standard implementation.
Firstly, to improve the convergence behaviour as the engine speed is varied, α-scheduling, as described in [9], is used to modify the convergence coefficient, α, according to the expression:
 (2)where λmax (ωc) is the maximum eigenvalue of GH G, where G is the plant responses matrix at the controlled frequency ωc, and γ is a scaling parameter, which is typically a positive constant adjusted manually by the system designer to offer a trade-off between system stability and convergence speed – it is set here to 1 × 10⁻³. Figure 8 shows how the value of α varies as a function of frequency. From these results it can be seen that the value of α varies quite significantly over the presented frequency range due to the characteristics of the plant responses and this offers a significant improvement in the speed of adaptation over frequency.
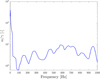 |
Figure 8 Trend of the α coefficient as a function of the frequency. |
Secondly, β-scheduling is used to limit the control effort dynamically and thus prevent the algorithm from diverging or damaging the actuators [18]. The β-scheduling process has two limiting effects: the first confines the maximum electrical power, to avoid over-driving the loudspeakers, and the second circumscribes the minimum frequency, thus avoiding driving the loudspeakers with high level signals below their operating frequency limit. The two components are described as follows:
-
The power limit is set so as to avoid over-driving the loudspeakers and must therefore be set according to the actuator properties. The limit is imposed by scheduling β as follows:
 (3)where PL is the power limit imposed based on the loudspeaker manufacturer’s specification, and w is the vector of control filter weights.
 -
The frequency limit is intended to avoid over-driving the loudspeakers below their low frequency operating limit. The limit is imposed by scheduling β as follows:
 (4)where fL is the low frequency threshold and f(n) is the current control frequency at time instant n. From the frequency response plots in Figure 3 it can be seen that this value will be low for the woofers but will be significantly higher for the tweeters.
The outputs from these two β-scheduling routines are then combined as β(n) = βP(n) + βf(n) in order to obtain a single value that is then used to limit the control action via leakage. Thus, the new weight update equation becomes
 (5)where Λ(n) is the matrix containing the vector of control effort weightings, β, on the main diagonal.
For reference, Figure 9 shows the value of β corresponding to the fifth order as the frequency of the order varies between 55 and 670 Hz. Only two of the four coefficients are shown: one, in blue, referring to a woofer and the other, in red, referring to a tweeter. The greatest differences are observed at low frequencies where βf corresponding to the tweeter is significantly larger than that for the woofer. At high frequencies, no particular differences are noticeable between the woofer and the tweeter, but the β values at these higher frequencies impose a limit on the power requirements.
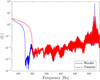 |
Figure 9 Variation in the β coefficients for one woofer and one tweeter as a function of the fifth engine order frequency. |
5 Control performance
This section presents the simulation results when applying the developed controller to the data recorded during the manoeuvres described in Section 2. The data used to conduct the simulations consists of the time histories of the signals measured at the headrest microphones and of the CAN bus data stream. In addition, measurements of plant responses have been made while the vehicle is stationary by feeding white noise to the loudspeakers and acquiring the signals at the headrest error microphones; examples of these plant responses for one woofer and one tweeter have been presented in Figure 3. Both the measurement of the acoustic sound field, i.e., the dynamic manoeuvre set, and the measurement of the plant responses were performed with both occupants seated inside the vehicle, such that the results represent a realistic vehicle operating condition.
The first part of this section presents a detailed analysis of the control system performance for the reference manoeuvre, i.e., the WOT in the main gear. Subsequently, the performance for the other manoeuvres is summarised in order to observe and compare the performance of the control system under different conditions.
In the first instance, before exploring the control performance, it is insightful to observe the spectrograms of the control effort required for control of the WOT main-gear driving condition for the woofer and tweeter with and without the β-scheduling routine described in the previous section; these results are shown in Figure 10. The difference between the control effort required by the woofers and tweeters without β-scheduling is evident: the woofer has a very strong low frequency output, while the tweeter operates predominantly at frequencies above 150 Hz. This can be linked back to the characteristic responses of the two loudspeakers as shown in Section 2. In the right-hand plots in Figure 10, the effect of the β-scheduling can be observed. In this case it can be seen that the low frequency control effort is limited by the algorithm – the low frequency limit of the woofer has been set to 50 Hz, and the limit for the tweeter has been set to 200 Hz. In addition, it is possible to notice that the β routine slightly limits the maximum control effort – with the levels corresponding to the engine orders being reduced as a result of the β-scheduling. The maximum power limit is set according to the specifications of the loudspeakers.
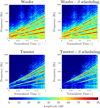 |
Figure 10 Control effort corresponding to the woofer and tweeter during the WOT in the main gear. The left-hand plots show the standard Fx-LMS algorithm; the right-hand plots show the control action modified by the β scheduling block. |
Having observed the effects of β-scheduling on the control effort, the performance with this scheduling in place can now be analysed. The control performance can be characterised by the attenuation in the error signals measured at the headrest microphones with and without control. Although it is often less biased to also observe the performance at monitoring microphones, which are not included in the control loop, the effect of averaging the performance across the error sensors is somewhat similar, particularly when including leakage in the controller, and avoids unrealistically high levels of control performance being predicted. Figure 11 shows the attenuation spectrogram averaged over the four error microphones at the headrests during the WOT manoeuvre in the main gear. The colour scale shows the level of noise mitigation in decibels, with green areas corresponding to 0 dB, or no change in the pressure level, positive values corresponding to attenuation and negative values corresponding to enhancement. It can be seen that the controller simultaneously controls the 4 targeted engine orders at the 4 error microphone positions, corresponding to the driver’s and passenger’s ears. From these results it can be seen that the controller does not attenuate the 4 engine orders uniformly over time, i.e., as the frequency varies. This is due to the spectral characteristics of both the plant responses and disturbance signals and, in general, the controller does not achieve significant control when the disturbance level without control is low. This can be related to the controller prioritising control of higher level components.
 |
Figure 11 Spectrogram of the attenuation averaged over the 4 error microphones during the WOT in the main gear. |
A couple more observations can be made based on these results. Firstly, the lowest controlled engine order is only attenuated at the end of the manoeuvre, which is because its frequency is below the operating range of the woofer units for the first part of the manoeuvre. On the contrary, with regard to the highest controlled engine order, significant control is achieved during the first part of the engine run-up, where the frequency of the engine order is low, but towards the end of the run-up the order corresponds to a frequency that is beyond the operating limits of the control system. To control to a higher frequency would require either more loudspeakers, or a local ANC system that may include head tracking in order to cope with head movements in practice. Although head movements have not been considered in the presented investigation, their influence on the control performance of ANC systems has been previously investigated [29] and shown to limit the high frequency performance in practice. However, it has also been previously shown that the zone of quiet created by an ANC system is increased in size through the use of multiple control sources and error sensors [30], as utilised here, and therefore it is expected that presented system will be relatively robust to head position over the presented frequency range.
Still focusing on the main-gear WOT manoeuvre, the loudness has been calculated [31] in order to provide an indication of the perceived subjective performance of the active control system. Loudness has been calculated according to ISO 532-1 [32] and is, therefore, reported in Sones/Bark. The Bark scale uses a logarithmic division of the frequency spectrum that reflects the frequency selectivity of the human ear. It spans from 1 to 24 barks, which correspond to bands with central frequencies equal to 50 Hz and 13.5 kHz, respectively [33]. Figure 12 shows the loudness before and after activating the control system and, from these results, it can be seen that although the loudness differs between the 4 error microphone locations, the controller provides a loudness reduction of around 5% at all locations, with peak reductions exceeding 7%. It can also be seen that, as expected, the control system only acts at low frequencies, where the 4 targeted engine orders occur, leaving the higher frequency response unaffected.
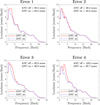 |
Figure 12 Specific loudness trend calculated according to ISO 532-1 for signals at the 4 error microphone locations. The top right box in each plots indicates the overall loudness values calculated in the two conditions – red solid line ANC off, blue dashed line ANC on. |
To assess the performance and stability of the controller in various situations, we now focus on summarising the results obtained for the four other vehicle manoeuvres described in Section 2. Figure 13 shows the attenuation spectrograms averaged over the four error microphone locations during the set of different manoeuvres used to validate the algorithm. It can be seen that the duration of each manoeuvre is different: starting from top right plot of Figure 13 that shows the shortest WOT performed in the low gear – therefore with higher acceleration and faster frequency variation – which lasts about half of the manoeuvre in the main gear; to bottom right plot of Figure 13 representing the high-gear WOT which takes about 50% longer. While the POT manoeuvre performed in the main gear, reported in top left plot of Figure 13, has a duration slightly longer than the WOT since the throttle valve is less open and so the car takes longer to reach the maximum engine speed. For the cruising manoeuvre, shown in the bottom left plot of Figure 13, an arbitrary time has been taken equal to the duration of the WOT in the main gear. In all four graphs, it can be seen that the algorithm is able to reduce the noise emission related to the engine orders. Also in these cases, the attenuation is not constant over the duration of the manoeuvre, except perhaps for the constant speed condition; this is due to the characteristics of the plant responses as discussed previously. For example, it can be seen that for the three dynamic manoeuvres there is an enhancement in the sound field towards the beginning of the manoeuvre, and this is more pronounced in the slower runs. This can be related to the plant responses and to the variation in the spectral characteristic of the engine emission, but the enhancement effect could be reduced by modifying the β-scheduling parameters. It can also be seen that the attenuation is lower as the frequency of the engine orders increases, which can be related to the reduced acoustic wavelength and the need for either a larger number of control sources or a local control strategy, as mentioned previously.
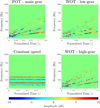 |
Figure 13 Spectrogram of the attenuation averaged over the 4 error microphones during the POT in the main gear. |
Finally, Figure 14 presents a comparison of the loudness during the 4 different manoeuvres before and after the control activation. In different ways, the controller is able to reduce the loudness in the analysed manoeuvres while keeping the algorithm parameters constant. The reduction is concentrated only at low frequencies, where the engine orders are located, whilst higher frequencies remain unaltered. The control system is able to reduce the overall acoustic loudness by an average of about 5%, with peaks of more than 7% under all manoeuvres, thus demonstrating the effectiveness of the controller for the different driving manoeuvres. It can also be noted that the effect of the controller in terms of the loudness measure is less significant for the constant speed condition and this can be related back to the results presented in the bottom left plot of Figure 6, where it can be seen that the engine orders are lower in amplitude during constant speed conditions than during the dynamic manoeuvres. From the loudness values in the off control condition, shown in the top right-hand corner of the graphs in Figure 14, it can be seen that the starting level during the constant speed manoeuvre is considerably lower compared to the other manoeuvres.
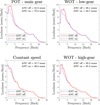 |
Figure 14 Specific loudness trend calculated according to the ISO 532-1 during the analysed manoeuvres, averaged over the 4 error microphone locations. The bottom left box indicates the overall loudness values calculated in the two conditions – solid red line ANC off, dashed blue line ANC on. |
6 Conclusions
This article has investigated the performance and stability of an active noise control system implemented within a two-seat super sports car equipped with a naturally aspirated engine. The purpose of the system is to control the sound generated by the engine in the vehicle cabin, by controlling 4 of the main orders at the driver’s and passenger’s ears, through the use of 4 loudspeakers housed inside the cabin.
Before proceeding with the simulated implementation of the controller, the sound during different manoeuvres has been analysed to enable an appropriate design of the control strategy. Four different dynamic manoeuvres with different accelerations, and one static manoeuvre, with constant speed, have been analysed. In all cases, the spectrum is mainly marked by the engine orders, i.e., harmonics with varying frequencies as a function of engine speed. The main contributions from the excitation produced by the engine are found at low frequencies up to around 1000 Hz, which is well suited to an active control solution. Therefore, an active engine noise control system has been proposed and investigated. It has been demonstrated that the controller is able to effectively attenuate 4 engine orders simultaneously during the set of analysed manoeuvres. All the simulations have been carried out with constant algorithm parameters in order to simulate a real situation and thus understand the performance and stability of the algorithm. The outputs of the simulations show effective control both in terms of reduction of the sound pressure level of the individual examined orders, and in terms of loudness, calculated according to the ISO 532-1 standard, which shows an overall average reduction in all manoeuvres of 5%, with peaks in some manoeuvres of over 7%.
Conflict of interest
The authors declare no conflict of interest.
Acknowledgments
The authors gratefully acknowledge the assistance of Automobili Lamborghini S.p.A. in carrying out the measurements used in this paper.
References
- P.A. Philip, S.J. Elliott: Active control of sound, Academic Press, 1992. [Google Scholar]
- S.M. Kuo, D.R. Morgan: Active noise control systems: Algorithms and DSP implementations, Wiley Interscience, 1996. [Google Scholar]
- S.J. Elliott: Signal Processing for Active Control, Academic Press, 2000. [Google Scholar]
- Y. Kajikawa, W.-S. Gan, S.M. Kuo: Recent advances on active noise control: Open issues and innovative applications. APSIPA Transactions on Signal and Information Processing 1 (2012) 1–21. [CrossRef] [Google Scholar]
- S.J. Elliott: Active noise and vibration control in vehicles. In: X. Wang, Ed. Vehicle noise and vibration refinement. Woodhead Publishing, 2010:235–251. [Google Scholar]
- Y. Zhao, R. Shuai, L. Zhu, P. Lin, Z. Liu: Active noise control of interior noise of a high-speed train carriage. In: D. Anderson, P.-E. Gautier, M. Iida, J.T. Nelson, D.J. Thompson, T. Tielkes, D.A. Towers, P. de Vos, J.C. O Nielsen, Eds. Noise and vibration mitigation for rail transportation systems. Springer International Publishing: Cham, 2018:451–459. [CrossRef] [Google Scholar]
- T. Haase, O. Unruh, S. Algermissen, M. Pohl: Active control of counter-rotating open rotor interior noise in a dornier 728 experimental aircraft. Journal of Sound and Vibration 376 (2016) 18–32. [CrossRef] [Google Scholar]
- S. Johansson: Active noise control in aircraft: Algorithms and applications. PhD thesis, Lund University, January 1998. [Google Scholar]
- J. Cheer, S.J. Elliott: Active noise control of a diesel generator in a luxury yacht. Applied Acoustics 105 (2016) 209–214. [CrossRef] [Google Scholar]
- E. Envia: Fan noise reduction: An overview. International Journal of Aeroacoustics 1, 1 (2002) 43–64. [CrossRef] [Google Scholar]
- S.J. Elliott, P.A. Nelson, I.M. Stothers, C.C. Boucher: In-flight experiments on the active control of propeller-induced cabin noise. Journal of Sound and Vibration 140, 2 (1990) 219–238. [CrossRef] [Google Scholar]
- P. Belanger, A. Berry, Y. Pasco, O. Robin, Y. St-Amant, S. Rajan: Multi-harmonic active structural acoustic control of a helicopter main transmission noise using the principal component analysis. Applied Acoustics 70, 1 (2009) 153–164. [CrossRef] [Google Scholar]
- T. Yoshida: Active noise control for tractor operator. Japan Agricoultural Research Quarterly 29 (1995) 161–170. [Google Scholar]
- S.M. Kuo, S. Mitra, W.-S. Gan: Active noise control system for headphone applications. IEEE Transactions on Control Systems Technology 14, 2 (2006) 331–335. [CrossRef] [Google Scholar]
- J. Cheer: Active sound control in the automotive interior. In: A. Fuchs, B. Brandstätter, Eds. Future interior concepts. Springer International Publishing: Cham, 2021:53–69. [Google Scholar]
- P.N. Samarasinghe, W. Zhang, T.D. Abhayapala: Recent advances in active noise control inside automobile cabins: Toward quieter cars. IEEE Signal Processing Magazine 33, 6 (2016) 61–73. [CrossRef] [Google Scholar]
- H. Sano: Applications of active noise and vibration control in vehicles. Noise & Vibration Worldwide 33, 8 (2002) 11–15. [Google Scholar]
- J. Cheer: Active control of the acoustic environment in an automobile cabin. PhD thesis, University of Southampton, December 2012. [Google Scholar]
- S.-K. Lee, S. Lee, J. Back, T. Shin: A new method for active cancellation of engine order noise in a passenger car. Applied Sciences 8, 8 (2018) 1394. [CrossRef] [Google Scholar]
- Y.-H. Lee, A. Nasiri: Real time active noise control of engine booming in passenger vehicles, in: SAE World Congress and Exhibition, SAE International, Apr. 2007. [Google Scholar]
- J. Cheer, S.J. Elliott: Multichannel control systems for the attenuation of interior road noise in vehicles. Mechanical Systems and Signal Processing 60–61 (2015) 753–769. [CrossRef] [Google Scholar]
- W. Jung, S.J. Elliott, J. Cheer: Local active control of road noise inside a vehicle. Mechanical Systems and Signal Processing 121 (2019) 144–157. [CrossRef] [Google Scholar]
- H. Sano, T. Inoue, A. Takahashi, K. Terai, Y. Nakamura: Active control system for low-frequency road noise combined with an audio system. IEEE Transactions on Speech and Audio Processing 9, 7 (2001) 755–763. [CrossRef] [Google Scholar]
- R. Schirmacher, R. Kunkel, M. Burghardt: Active noise control for the 4.0 TFSI with cylinder on demand technology in audi’s S-series. 2012. SAE Technical Paper. [Google Scholar]
- N. Zafeiropoulos: Active noise control in a luxury vehicle. PhD thesis, University of Salford, December 2015. [Google Scholar]
- S.J. Elliott, I.M. Stothers, P.A. Nelson: A multiple error LMS algorithm and its application to the active control of sound and vibration. IEEE Transactions on Acoustics, Speech, and Signal Processing 35, 10 (1987) 1423–1434. [CrossRef] [Google Scholar]
- L. Lu, K.-L. Yin, R.C. de Lamare, Z. Zheng, Y. Yi, X. Yang, B. Chen: A survey on active noise control in the past decade – Part I: Linear systems. Signal Processing 183 (2021) 108039. [CrossRef] [Google Scholar]
- L. Lu, K.-L. Yin, R.C. de Lamare, Z. Zheng, Y. Yi, X. Yang, B. Chen: A survey on active noise control in the past decade – Part II: Nonlinear systems. Signal Processing 181 (2021) 107929. [CrossRef] [Google Scholar]
- S.J. Elliott, W. Jung, J. Cheer: Head tracking extends local active control of broadband sound to higher frequencies. Scientific Reports 8, 1 (2018) 5403. [CrossRef] [PubMed] [Google Scholar]
- S.J. Elliott, J. Cheer: Modeling local active sound control with remote sensors in spatially random pressure fields. The Journal of the Acoustical Society of America 137 (2015) 1936–1946. [CrossRef] [PubMed] [Google Scholar]
- H. Fastl, E. Zwicker: Psychoacoustics: Facts and models. Springer, 1990. [Google Scholar]
- ISO 532–1:2017(E): Acoustics – Methods for calculating loudness – Part 1: Zwicker method. International Organization for Standardization, 2017. [Google Scholar]
- E. Zwicker: Subdivision of the audible frequency range into critical bands (Frequenzgruppen). The Journal of the Acoustical Society of America 33 (1961) 248. [CrossRef] [Google Scholar]
Cite this article as: Ferrari CL. Cheer J. & Mautone M. 2023. Investigation of an engine order noise cancellation system in a super sports car. Acta Acustica, 7, 1.
All Figures
|
Figure 1 Actual scheme and positioning of the control system (microphones and loudspeakers) in the car cabin. |
| In the text | |
|
Figure 2 Block diagram of the ANC system highlighting the direction of the data flow in the control system. |
| In the text | |
|
Figure 3 Plant responses between one woofer (solid line) and one tweeter (dashed line) and one of the error microphones at the headrest. |
| In the text | |
|
Figure 4 Comparison of the engine speed time histories of the analysed manoeuvres. |
| In the text | |
|
Figure 5 Normalised spectrogram of the sound pressure level measured at one of the headrest microphones during the WOT manoeuvre in the main gear. |
| In the text | |
|
Figure 6 Normalised spectrogram of the sound pressure level measured at one of the headrest microphones during the POT manoeuvre in the main gear. |
| In the text | |
|
Figure 7 Block diagram of the single-frequency Fx-LMS algorithm. |
| In the text | |
|
Figure 8 Trend of the α coefficient as a function of the frequency. |
| In the text | |
|
Figure 9 Variation in the β coefficients for one woofer and one tweeter as a function of the fifth engine order frequency. |
| In the text | |
|
Figure 10 Control effort corresponding to the woofer and tweeter during the WOT in the main gear. The left-hand plots show the standard Fx-LMS algorithm; the right-hand plots show the control action modified by the β scheduling block. |
| In the text | |
|
Figure 11 Spectrogram of the attenuation averaged over the 4 error microphones during the WOT in the main gear. |
| In the text | |
|
Figure 12 Specific loudness trend calculated according to ISO 532-1 for signals at the 4 error microphone locations. The top right box in each plots indicates the overall loudness values calculated in the two conditions – red solid line ANC off, blue dashed line ANC on. |
| In the text | |
|
Figure 13 Spectrogram of the attenuation averaged over the 4 error microphones during the POT in the main gear. |
| In the text | |
|
Figure 14 Specific loudness trend calculated according to the ISO 532-1 during the analysed manoeuvres, averaged over the 4 error microphone locations. The bottom left box indicates the overall loudness values calculated in the two conditions – solid red line ANC off, dashed blue line ANC on. |
| In the text | |
Current usage metrics show cumulative count of Article Views (full-text article views including HTML views, PDF and ePub downloads, according to the available data) and Abstracts Views on Vision4Press platform.
Data correspond to usage on the plateform after 2015. The current usage metrics is available 48-96 hours after online publication and is updated daily on week days.
Initial download of the metrics may take a while.