Fig. 9
Download original image
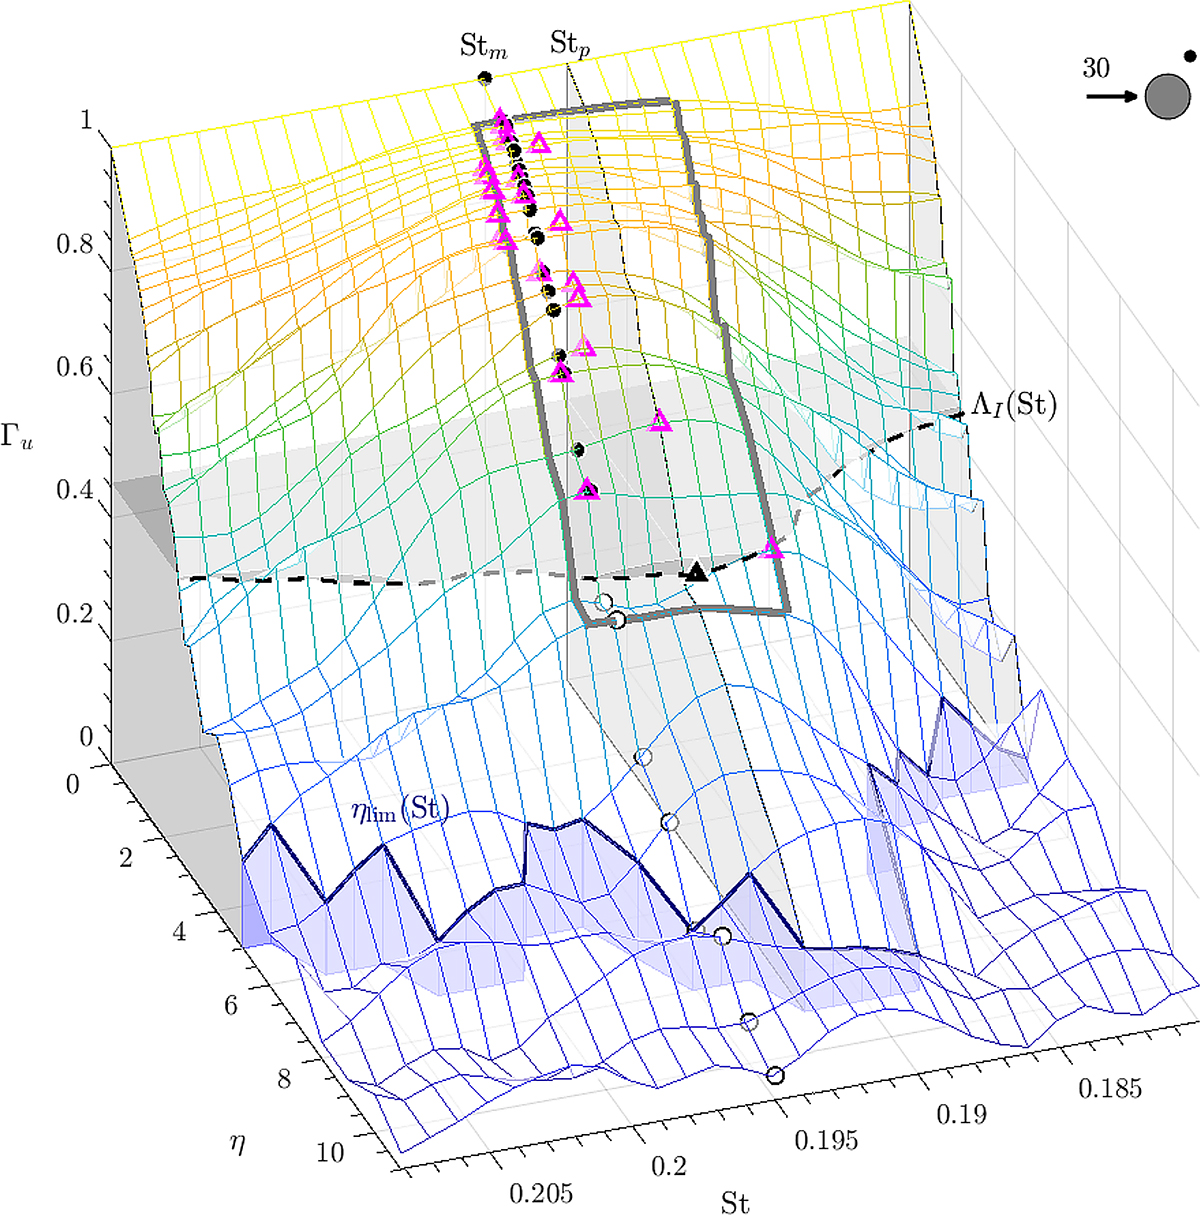
Surface plot of coherence data Γu(η, St) illustrating the nomenclature and methodology for the estimation of Stp and its bounding. Dashed line: integral coherence length ΛI at a given Strouhal number; blue line and panels: ηlim, limit of quadrature evaluation indicated by the vertical grayed areas; filled triangle (▲): peak of coherence length at Stp; open triangles (△): maxima of coherence at a given lag; thick grey lines: Strouhal number uncertainty range around Stp; filled circles (•): lags below ηmax = ΛI used for model fit at Stm; open circles (○): η > ηmax. Data for the circular cylinder flow at Re = 20,000.
Current usage metrics show cumulative count of Article Views (full-text article views including HTML views, PDF and ePub downloads, according to the available data) and Abstracts Views on Vision4Press platform.
Data correspond to usage on the plateform after 2015. The current usage metrics is available 48-96 hours after online publication and is updated daily on week days.
Initial download of the metrics may take a while.