| Issue |
Acta Acust.
Volume 6, 2022
Topical Issue - Aeroacoustics: state of art and future trends
|
|
|---|---|---|
| Article Number | 59 | |
| Number of page(s) | 14 | |
| DOI | https://doi.org/10.1051/aacus/2022053 | |
| Published online | 09 December 2022 | |
Scientific Article
Influence of end plate placement on the reduction of airfoil tip vortex formation noise
1
Technische Universität Berlin, Einsteinufer 25, 10587 Berlin, Germany
2
BTU Cottbus-Senftenberg, Siemens-Halske-Ring 14, 03046 Cottbus, Germany
* Corrsponding author: This email address is being protected from spambots. You need JavaScript enabled to view it.
Received:
5
April
2022
Accepted:
10
November
2022
Abstract
The tonal noise generated at the tip is a major contribution to the aerodynamic noise generated by three-dimensional airfoils. One way to reduce this noise is the use of end plates, which was investigated in the present study for three different circular end plate geometries applied to a cambered NACA 4412 airfoil with aspect ratio 2 and forced boundary layer transition. Microphone array measurements were performed in a small aeroacoustic wind tunnel for chord based Reynolds numbers between 75,000 and 200,000 and geometric angles of attack between 0° and 20°. The acoustic far-field noise spectra obtained for the baseline configuration show a broadband hump centered at a chord based Strouhal number of 13 that is associated with the noise generation at the tip and scales with the third power of the flow velocity. The application of end plates reduces this peak and is most effective for end plates which bound the flow on the suction side of the airfoil. Hot-wire measurements taken for one configuration show that the end plates diffuse the turbulence intensity in the relevant frequency range and reduce the fluid transfer along the pressure gradient at the tip. The suction side end plate additionally prevents the interaction of turbulent structures with the trailing edge and is therefore more effective in reducing noise. Surface flow visualizations for this configuration reveal a separation line extending along the full span up to the tip while the surface flow of the baseline and pressure configuration is strongly affected by the flow swept around the tip. Therefore, the placement of the end plate on the suction side is more effective in reducing tip noise.
© The Author(s), Published by EDP Sciences, 2022
 This is an Open Access article distributed under the terms of the Creative Commons Attribution License (https://creativecommons.org/licenses/by/4.0), which permits unrestricted use, distribution, and reproduction in any medium, provided the original work is properly cited.
1 Introduction
Lifting airfoils are found in a wide range of technical applications like aircraft or wind turbine blades. To reduce noise pollution and meet regulations, low-noise airfoils are demanded. Airfoil self-noise is created by the interaction between an airfoil blade and the turbulence produced in its own boundary layer and near wake [1]. Especially for high lifting devices such as landing flaps the noise contribution from tip vortex formation can be very important because the high pressure gradient accelerates fluid around the edge. For rotating airfoils, where the flow velocity is highest at the tip, this region contributes a high noise emission as well [2].
Focusing on the stationary case, Guo [3] identified two noise generation mechanisms for aircraft flaps: flow separation near the sharp corners of the flap and the interactions between the large scale vortex structure and the sharp corners of the flap. The shear layer unsteadiness and vortex unsteadiness interacting with the edge and surface result in sound radiation to the far field [4]. Moreau and Doolan [5] and Moreau et al. [6] showed that this tip vortex formation noise manifests itself as a broad peak or hump in the noise spectrum. Zhang et al. [7] examined the effect of airfoil surface curvature and profile thickness on tip vortex formation noise and reported that tip noise is a strong contributor to the mid to high frequency airfoil noise. They found that increasing the camber also increases the noise level but does not affect the frequency of the tip noise peak. The presence of a rounded tip was found to lead to decreasing noise levels.
As most of these studies focus on the description of the tip vortex formation noise, it is also important to investigate how to reduce the strength of the physical noise source mechanism. One possible way to reduce tip vortex formation noise is to prevent the flow going around the free end. In a numerical study, Ebrahimi and Mardani [8] achieved to reduce the noise emission at high-frequencies by using a winglet on the suction side of a wind turbine blade. In an experimental study preceding the current one, Schneehagen et al. [9] showed that the application of end plates can reduce the fluid transfer from the pressure to the suction side at the free end and diffuse the vorticity, which leads to a significant reduction of tip noise. This was observed both for a symmetric NACA 0012 airfoil and for a cambered NACA 4412 airfoil at chord-based Reynolds numbers between 75,000 and 225,000. Although the geometry of the three end plates that were considered did not have a strong influence on the noise reduction, it was found that a circular end plate performed best for both airfoils. It is important to note that all end plates considered in [9] were symmetrical to the airfoil chord line, and hence potential differences between the suction side flow field and the pressure side flow field on the noise reduction have not been examined. The current study aims to investigate the influence of the placement of the end plate: whether it is more effective to prevent the flow going around the edge on the pressure or suction side or if both sides are needed in order to reduce vortex formation noise.
Therefore the influence of the end plate placement on the noise reduction effect is investigated in an aeroacoustic wind tunnel. The current measurements focus on a cambered NACA 4412 airfoil because the influence of camber was already described in previous studies and the focus of the current work is on the placement of the end plates. The results presented in this paper were obtained for chord-based Reynolds numbers from 75,000 to 200,000 in increments of 25,000. The angle of attack ranges from 0° to 20° in 5-steps.
The paper is organized as follows: First, the experimental methods and data processing are described in Section 2. Then the results of the acoustic and flow measurements are presented in Section 3. Finally, in Section 4 concluding remarks are given.
2 Experimental method
2.1 Airfoil models
For the measurements a cambered NACA 4412 airfoil with a chord length C = 70 mm and a span width L = 140 mm was used, resulting in an aspect ratio of L/C = 2. The airfoil model and the end plates were 3D-printed using polylactide and polished to achieve a smooth surface. Forced boundary layer transition was achieved by using 60-degree zig-zag trip tape (manufactured by Glasfaser Flugzeugservice) with 0.4 mm thickness and 6 mm point-to-point distance, applied to both sides of the airfoil at 10% chord. The end plates have a thickness of 2 mm and untreated edges. Three different end plate configurations were investigated and can be seen in Figure 1: a full circle with a diameter equal to the chord length, a half circle with the same diameter on the pressure side and a similar half circle on the suction side. For the half circle designs, the remaining upper or lower contours follow the shape of the airfoil cross-section. The end plates were mounted to the free end of the airfoil with double sided adhesive tape.
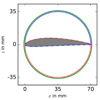 |
Figure 1 End plate geometries on NACA 4412 (grey), full circle with diameter corresponding to the chord length of 70 mm (green), half circle on suction side (blue), half circle on pressure side (red). |
2.2 Wind tunnel
Two different facilities were used for the experiments. The microphone array measurements as well as the surface flow visualizations were performed in the small aeroacoustic open jet wind tunnel at the Brandenburg University of Technology (BTU) Cottbus – Senftenberg [10], while the hot-wire anemometry measurements were performed in the aeroacoustic wind tunnel at the Technical University (TU) Berlin [11].
Figure 2a shows a photograph of the set-up inside the wind tunnel at BTU. A nozzle with a rectangular exit area of 0.23 m × 0.28 m was used in these measurements, which enables a maximum flow velocity in the order of 60 m/s with a very low turbulence. The airfoil models are attached to a side plate made of acrylic glass, which was fixed to the side of the nozzle. The side walls of the wind tunnel test section are covered with a 0.25 m thick absorbing foam, which leads to a quasi anechoic acoustic environment for third-octave bands with center frequencies above 100 Hz. In the experiments, the airfoil angle of attack was adjusted using an electronic angle meter placed on a ledge parallel to the airfoil chord line. As has been described in [9], it should be noted that for airfoils with finite span the effective angle of attack changes along the spanwise direction. This can be corrected for airfoil models without end plates using the procedure reported by Awasthi et al. [12]. However, no correction method for the effective angle of attack is available for airfoils with end plates, and hence it was decided to perform all far-field noise comparisons at the same geometric angles of attack and not at the same lifting conditions. The reader is referred to [9] for a more detailed discussion on the aerodynamic effect of end plates on the angle of attack.
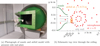 |
Figure 2 Acoustical measurement set up in aeroacoustic wind tunnel at BTU. |
The aeroacoustic wind tunnel at TU Berlin is a free jet wind tunnel in an anechoic environment. The rectangular nozzle used for the hot-wire measurements is 0.33 m in height and 0.4 m in width achieving a maximum flow velocity of 70 m/s. At 32 m/s the mean turbulence intensity is less than 0.5% over the cross section.
2.3 Acoustic measurement set-up and data processing
The set-up for the acoustic measurements is basically similar to the one described in [9], using a planar microphone array consisting of 47 1/4th inch electret microphone capsules flush-mounted into an aluminium plate with dimensions of 1.5 m × 1.5 m. These microphones are in direct line of sight of the airfoil and a subset of a 64 channel microphone array. As shown in the schematic in Figure 2b, the array was positioned out of flow, at a distance of 0.71 m above the airfoil models.
All measurements were conducted using a sampling frequency of 51.2 kHz and a measurement duration of 40 s. In post-processing, the data were first transferred to the frequency domain using Welch’s method [13] on Hanning-windowed blocks of 4096 samples with an overlap of 50%. In a second step, the CLEAN-SC beamforming algorithm [14], as implemented in the open source software package Acoular [15], was applied to the data. The chosen focus grid was parallel to the microphone array and aligned with the airfoil at zero angle of attack. It had an extent of 0.4 m in the streamwise direction and 0.4 m in the spanwise direction, with a resolution of 0.01 m. The effect of the wind tunnel shear layer on the noise source localization was corrected using a ray tracing approach [16] that makes use of the analytical approximation of the mean flow pattern of a slot jet [17]. The result of the beamforming are two-dimensional maps of the sound source locations. In order to obtain quantitative spectra, the sound source contributions were integrated over the sectors shown in Figure 3a, thus allowing to analyze only the noise sources of interest, while excluding unwanted (background) noise sources such as the wind tunnel nozzle. Finally, the integrated spectra were converted to sound pressure levels with a reference value of 20 μPa and 6 dB were subtracted to account for the sound reflection at the rigid array plate.
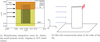 |
Figure 3 Measurement evaluation areas. |
2.4 Hot-wire measurement set-up
To get a better understanding of the flow structures in the wake of the airfoil tip, constant temperature anemometry (CTA) measurements were taken for an angle of attack of 15° and a Reynolds number of 150,000 for the base configuration and the half circle attached to the pressure and suction side. A Dantec miniature X-wire probe 55P54 in combination with a Dantec StreamLine Pro CTA Module was used to measure the mean velocity and velocity fluctuations in both the streamwise direction x and in the direction z perpendicular to the flow and the span/trailing edge. To take into account temperature effects during the measurements, a Dantec 90P10 temperature probe was used for correction. Both probes were connected to a National Instruments NI-DAQ Interface NI USB 9215 with a sampling frequency of 40 kHz. This allows frequency analysis of the fluctuating velocity components up to 20 kHz. The probe was positioned using a three-dimensional Unipos 110 traverse system with a minimum step size of 0.1 mm. The flow velocity-time signal was measured for 7 s at discrete points in the yz-plane, 0.1 chord lengths downstream of the trailing edge. The measurement-plane is depicted in Figure 3b. At each measuring point the data acquisition started with 4 s delay to damp possible vibrations of the hot wire probe caused by the movement of the traverse. At each point, the mean velocity components U (in streamwise direction x) and W (in vertical direction z) as well as the root-mean-square values of the velocity fluctuations in streamwise urms and vertical (upwash) direction wrms are calculated. The total turbulence intensity was then calculated as
 (1)
(1)
with U0 being the outer flow speed.
2.5 Surface flow visualizations
In order to obtain information on the effect of the different end plates on the flow in the direct vicinity of the airfoils, surface flow visualizations were performed on a subset of the configurations in the BTU wind tunnel. This was done using the same method as in [18], which makes use of a mixture of UV fluorescent powder mixed with white spirit and oleic acid. This mixture is applied to the surface of the airfoil when the wind tunnel is switched off. When the wind tunnel is then switched on, the spirit evaporates, leaving the powder aligned with the streamlines over the surface of the airfoil. In order to improve the contrast, the airfoil surfaces were spray painted black. Each run was performed twice and a comparison of the results showed similar characteristic flow features for both runs. Due to the difficulty to apply the mixture evenly and without loosening the tape, it was decided to perform the measurements without the tripping. Acoustics measurements from [9] show that the main features in the spectra associated to the tip noise remain the same regardless of the tripping. Therefore, the flow features at the tip of the untripped airfoil are applicable to the acoustic results of the tripped airfoil.
3 Experimental results
3.1 Beaforming results
In Figure 4 the integrated sound pressure levels of the configurations are shown for all flow speeds and for all angles of attack except 0°. The sound pressure levels are scaled with the third power of the flow velocity U0 and plotted over the chord based Strouhal number St = Cf/U0. This approach has been found to provide the best fit regarding the level of the high frequency broadband hump of the base configuration that is associated with tip vortex formation noise [9]. The scaling captures the underlying acoustic source mechanism in the range of Strouhal numbers from 5 to 18 for 5° and 10° angle of attack and allows to compare the noise reducing effect of the different end plate configurations. The comparison at the same geometric angle of attack instead of same lift is justified by preliminary results from recent aerodynamic measurements on wall-mounted finite airfoils at TU Berlin, which indicate that the lift is increased for angles of attack higher than 5° for the considered end plates compared to the base configuration. Therefore, the noise reduction effect compared to the baseline at a higher geometric angle of attack would be even more favourable.
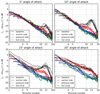 |
Figure 4 Velocity-scaled sound pressure levels integrated over whole airfoil for all configurations and flow speeds for different angles of attack. |
For lower Strouhal numbers, a different source mechanism with a higher order velocity scaling seems to be apparent, as the sound pressure levels increase with increasing flow velocity. In this frequency range, the sound pressure levels scale with the fifth power of the flow velocity as typical edge noise sources [19]. The classical fifth-power-scaling was also used by Brooks and Marcolini [20] for Strouhal numbers smaller than 5 as well as in other studies on flap side edge noise [3, 21, 22] and wind turbine noise [23]. These studies focus on the scaling of the overall trailing edge noise spectrum, though, and do not contradict the current approach chosen to scale solely the tip noise contribution.
The baseline configuration of the airfoil generates a broadband hump with a peak Strouhal number of 13 for 5°–15° angle of attack and all flow velocities. At 10° and 15° the peak level is around 5 dB higher than for 5° angle of attack. For the highest angle of attack of the present study this peak becomes less prominent and broadens towards lower frequencies. This is in agreement with previous measurements on an untripped NACA 4412 at similar Reynolds numbers [9], which also showed peaks in the acoustic spectrum around chord based Strouhal numbers between 12 and 15. Moreau and Doolan [24] also identified a tonal peak at St = 13 for a NACA 0012 (L/C = 3) at an angle of attack of 6° and flow velocities between 40 m/s and 60 m/s. Angland et al. [25] also reported in their hot wire measurements in the flow field around a flap side edge that the velocity perturbations in the off-surface vortex had a chord based Strouhal number of 13.2. This is another strong indicator that the fluctuations in the direct vicinity of the vortex are responsible for the radiated sound. More recently, Zhang et al. [7] stated that the frequency of the peak increases with Reynolds number but does not depend on angle of attack, which is also observed in the current measurement results.
All end plates achieve a reduction of the broadband peak, with the exception of the end plate on the pressure side for the highest angle of attack. For this configuration, the sound pressure level spectrum is almost identical to the baseline configuration and well above the spectra obtained for the end plate on the suction side and the full circle. For lower angles of attack, these two end plate designs also perform better than the end plate on the pressure side, for which a hump with smaller St and amplitude is observed. With higher angles of attack, this hump increases and at 20° has the same level as the baseline configuration. In other words, the end plates that bound the flow on the suction side show very similar behaviour for all angles of attack and prove to be most effective in reducing tonal noise from the wing tip for this NACA 4412 airfoil. For Strouhal numbers below 5 the end plates have no effect on the acoustic spectra.
To locate the sound source responsible for the broadband hump, third octave band sound maps are shown exemplary in Figure 5 for the relevant center frequencies. For brevity, results for the full circle end plate are not shown because the results are basically identical to those observed for the suction side end plate. It is visible that for the selected frequency bands the dominant sound source is located at the trailing edge of the free end. Additionally, a weaker source is located at the leading edge at the wall junction, which is not affected by the end plates. This source is due to the interaction of the wall boundary layer with the airfoil leading edge. Thus, the sound maps confirm that the end plates weaken the strength of the acoustic source at the tip. For the baseline and the pressure side a second weaker source at (x, y) = (−0.22, 0) is visible. This source could be associated with the formation of a secondary vortex emerging from the tip side edge [4] which is prevented when the end plate is attached to the suction side.
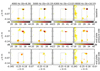 |
Figure 5 Third octave sound maps obtained at Re = 150,000 and 15° angle of attack, top baseline configuration, middle end plate pressure side, bottom end plate suction side, flow from left to right, black dotted line represents airfoil and wall, view on the suction side. |
Additionally in the appendix, the sound maps for the same configurations at an angle of attack of 10° are shown in Figure A1. The source distribution does not alter significantly between these two angles of attack and again the strongest source is found at the airfoil tip for the base configuration. For the lowest two third octave bands considered, additional sources are found along the trailing edge for all configurations. The second source at the tip edge is less pronounced for the baseline and end plate pressure side compared to the higher angle of attack. Overall, it can again be observed for both angles of attack considered that the noise reduction is higher when the end plate is applied to the suction side of the airfoil.
To emphasize the importance of the tip contribution to the sound pressure level spectra, the results from the tip integration area are compared to those from the entire airfoil in Figure 6. The integrated third octave sound pressure levels correspond to the configurations from the sound maps shown in Figures 5 and A1 plus an additional lower and higher flow velocity. The baseline configuration shows the characteristic broadband hump that is shifted towards higher frequencies with increasing flow speed. As there is no level difference between the two different integration sectors, it becomes clear that the origin of the noise is the airfoil tip area. Interestingly, in the same frequency range this also applies to the end plate on the pressure side. Hence, the reason for the higher level compared to the end plate on the suction side is also found in the tip area. For the end plate on the suction side there is a level difference between the two integration areas which implies a different source mechanism or location. For all configurations the influence of the tip decreases towards lower frequencies.
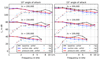 |
Figure 6 Third octave sound pressure levels integrated over whole airfoil or only the tip region (according to Fig. 3a), between each flow speed 30 dB are added to avoid overlay. |
In an attempt to quantify the noise reduction potential of the different end plates, the overall sound pressure level differences between the baseline configuration and each single end plate configuration were calculated. To this end, sound pressure levels were analyzed that were obtained from integration over different source regions, as specified in Figure 3a and with the same intention as in the previous paragraph. This was done for all angles of attack and Reynolds numbers of the current study. The results are depicted in Figure 7, where the top row shows the difference obtained for the integration area of the whole airfoil and the bottom row considers only the tip integration area, respectively. It can be seen that for higher angles of attack, the end plates have a favourable effect for almost all flow velocities. As stated before, the noise reduction is more effective for the circular end plate and the suction side end plate. Overall, the sound pressure level difference is highest for low Reynolds numbers and high angles of attack. When only the noise radiated from the tip region is considered, noise reductions exceeding 12 dB are observed for some configurations at high angles of attack and low Reynolds numbers.
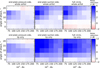 |
Figure 7 Overall sound pressure level difference of integrated spectra between base configuration and end plate applied, St < 18 and f > 1 kHz, integration area whole airfoil (top) or only tip (bottom) according to Fig. 3a, blue indicates noise reduction and red increase, note different color-bars. |
3.2 Hot-wire measurement results
To understand how the application of end plates affects the flow field at the tip and why it is more effective to place the end plate on the suction side, the results from hot-wire measurements in the vicinity of the tip are presented in Figure 8 for 15° angle of attack and a Reynolds number of 150,000. As already shown in Figure 5, the strongest source for this configuration is located at the trailing edge of the tip for the baseline configuration, resulting in the described broadband peak in the sound pressure level spectrum. This peak is reduced by around 3 dB when an end plate is applied on the pressure side and by 8 dB when it is applied to the suction side. In the hot-wire measurements, the measurement plane is located 0.1 chord lengths downstream of the trailing edge and the free end is located at x = y = 0 (see also Fig. 3b). Only the outermost 15 mm of the airfoil span are shown here. For the baseline configuration (left column) and the configuration with the end plate on the pressure side (center column), a strong vortex structure with high turbulence intensity Tu is present on the suction side. The mean upwash velocity W shows considerable fluid transfer from the region of high pressure on the pressure side towards lower pressure at the suction side around the airfoil tip. Compared to the baseline case, the velocity amplitude is smaller when the end plate is applied, because it prevents direct fluid transfer from the pressure to the suction side around the edge of the free end. The fluid has to take the detour around the end plate and therefore the pressure gradient accelerating the fluid is reduced. The suction side configuration (right column) leads to areas of high turbulence intensity along the pressure gradient, which is visible next to the end plate in the free stream and on top of the end plate. In addition, a region of high turbulence intensity exists in the wake of the end plate, which is probably due to vortex shedding from the edge of the plate. Interestingly, this not the case for the pressure side end plate. The mean upwash velocity also shows fluid moving over the top of the end plate, but in contrast the area above the trailing edge shows a velocity deficit. This could be due to the 2D-like behaviour of the flow when the end plate is applied, which leads to a reduction of the effective angle of attack as discussed in [9]. For the configurations without an end plate on the pressure side, this reduction of the effective angle does not occur, and therefore the flow separates at such high angles of attack considered here. Also, for the configuration with the end plate on the suction side the mean streamwise velocity U shows a deficit at the airfoil trailing edge, which is not apparent for the other two configurations.
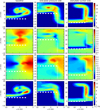 |
Figure 8 Turbulence intensity Tu, mean streamwise velocity U, mean upwash velocity W and turbulence intensity TuSt frequency filtered from St = 8 to St = 18, 15° angle of attack, Re = 150,000: baseline (left), end plate pressure side (middle), end plate suction side (right), (measurement plane located 0.1 chord lengths downstream of the airfoil (see Fig. 3b), white dashed line indicates trailing edge – vertical line indicates end plate (suction side above). |
The high temporal resolution of the CTA measurement data allows spectral filtering of the fluctuation components and therefore makes it possible to identify flow structures with the same frequency content as the broadband peak in the acoustic spectra. Consequently, in the last row of Figure 8 the turbulence intensity is only shown in the Strouhal number range from 8 to 18 (3800–8600 Hz at U0 = 32 m/s) that is relevant for the tip noise. The result obtained for the baseline configuration shows a strong turbulent core close to the trailing edge that has the highest turbulence intensity of all three configurations. The pressure side end plate configuration also leads to some turbulent structures near the trailing edge, but the size and intensity are notably smaller compared to the baseline. This agrees with the work of Zaman et al. [26], who reported that a downward pointing winglet produces a split vortex with significant decrease in peak vorticity. The suction side end plate configuration shows high turbulence intensity in the wake of the end plate and on the right side of the plate in the free stream. In contrast to the baseline and pressure side configuration this vortex does not interact with the trailing edge as it is located in the free stream instead of the airfoil suction side. Together with the comparison of the acoustic spectra it can be suggested that only the structures interacting with the trailing edge are relevant for the radiation of sound to the far-field associated with tip vortex formation noise.
To summarize the findings from the hot-wire measurements, the following factors could be a possible explanation why the end plate on the suction side is more effective in reducing noise: firstly, there is no vortex core with high turbulence intensity in the tip noise relevant frequency range apparent and also the upward fluid motion is reduced. This is the case for both end plate configurations. Secondly, the vortex is further displaced from the airfoil surface and therefore the interaction of turbulent fluctuations with the trailing edge is lessened. This could explain why the radiated sound in comparison to cases where the end plate is placed on the pressure side is reduced.
3.3 Surface flow visualization
Results from the surface flow visualizations are given in Figure 9 for three cases (baseline configuration, end plate on the pressure side only, end plate on the suction side only) at an angle of attack of 10° and a chord-based Reynolds number of 150,000. The flow conditions of the configurations correspond to sound maps from Figure A1. The stream lines on the suction side of the airfoil surface show very similar behaviour in the first 80% of the airfoil span from the wall on the left side. Near the wall the growth of the incoming wall boundary layer along the airfoil chord is visible. The flow in the mid span region, which is neither affected by the presence of the wall nor the tip, shows streamlines aligned to the mean flow direction from the leading edge until the separation line at about 40% of the chord. For the tripped airfoils considered for the acoustic and hot-wire measurements, this boundary between the attached, laminar flow and the separated, turbulent flow would be located further upstream at the tripping tape at 10% of the chord. When an end plate is present at the suction side (Fig. 9a), this line extends almost up to the tip, and the streamlines suggest an almost two-dimensional flow along the span. This explains the velocity deficit in the mean upwash velocity V observed in the hot-wire measurement results (Fig. 8) for this configuration, because it confirms that the flow separates along the full span up to the tip region. The visualizations obtained for the other two configurations (Fig. 9a and b) show streamlines coming from the tip interfering spanwise with the separation line. At the edge of the baseline configuration, around 40% chord, a structure starts to emerge which grows towards the trailing edge and is connected to the roll up of the shear layer from the pressure side and subsequent vortex formation. At the very tip of the trailing edge a spot with no fluorescent powder is seen exactly at the position where the strongest acoustic source is located in the sound maps (Fig. A1), indicating high pressure fluctuations at this location. For the end plate on the pressure side the surface flow is very similar although the described tip vortex structure seems to be less pronounced. The second, weaker source found on the side edge in the sound maps could be associated to the tip cross flow and the interaction with the side edge. The pressure side end plate for which this source is strongest shows in this region a dark area indicating high pressure and therefore potential acoustic radiation. The reason why this flow feature is more pronounced for the pressure side end plate might be that the edge of the plate differs slightly from the airfoil edge resulting in different flow interaction. However, this is currently only speculation and needs to be further investigated.
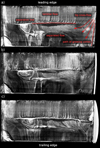 |
Figure 9 Surface flow visualization suction side NACA 4412 for Re = 150,000 and angle of attack 10°, flow from top to bottom, left side wall, right side free end, (a) baseline configuration, (b) end plate on the pressure side, (c) end plate on the suction side. |
Additionally in the appendix, the comparison of the surface flow visualization for 10° and 15° angle of attack is provided for the baseline and the end plate on the suction side in Figure A2. As expected the separation line is closer to the leading edge for the higher angle of attack. The main flow features at the tip for the baseline – the cross flow and growing vortex – are found for both angles of attack. As the pressure gradient is also larger for the higher angle of attack not only the flow separation occurs further downstream but also the tip vortex emerges further upstream at the side edge. As a result the spanwise extension of the vortex as well as the size of the spot with high pressure fluctuations are larger at the trailing edge. Genç et al. [27] also reported for their aerodynamic studies on a NACA 4412 that with increasing angle of attack the formation of the wing tip vortex got larger and moved towards the leading edge. These tip flow features are again not found with the end plate on the suction side and the separation extends almost until the end plate. The similar flow features are in agreement with the acoustical spectra and sound maps which also show similar results for these angles of attack.
4 Conclusions
This paper experimentally investigates the influence of end plates on the flow field at the tip of a NACA 4412 airfoil and the associated vortex formation noise. Microphone array measurements performed in the aeroacoustic wind tunnel at BTU showed that for the baseline configuration without end plate the dominant noise source is located at the trailing edge of the free end for Strouhal numbers between 8 and 18. In this range the isolated tip noise was found to scale with the third power of the flow velocity. The application of end plates reduces the noise most effectively for those configurations for which the end plates are pointed towards the suction side. Configurations with pressure side end plate still lead to a tonal noise contribution at higher angles of attack and pressure gradient and are not effective at all at the highest angle of attack of 20°. The overall noise reduction can reach values of up to 5 dB regarding the whole airfoil source region and over 6 dB for the airfoil tip region for a wide range of Reynolds numbers and high angles of attack.
Hot wire measurements of the mean flow velocities for one configuration showed that without the end plates fluid moves around the airfoil edge from the pressure to the suction side. A vortex structure with high turbulence intensity in the acoustically relevant frequency range forms close to the trailing edge. For the pressure side end plate, a vortex can be observed. Although the corresponding turbulence intensity is weak, the acoustic signature of this vortex is visible in the far-field noise spectra. For the end plate on the suction side, fluid moves over the end plate, but the distance between the top of the end plate and the airfoil trailing edge is much higher. Consequently, the highest turbulence intensity is found in the wake of the end plate, but it does not interact with the trailing edge, leading to the observed weakening of the tip noise source.
In addition, surface flow visualizations on the suction side of the airfoil show fluid swept around the tip for the baseline configuration (without end plate) and the pressure side configuration, which affects the flow separation on the airfoil surface. For the end plate on the suction side the stream lines show a quasi two-dimensional flow behaviour along the whole span for both angles of attack considered.
Overall, the current results indicate for the NACA 4412 that a placement of the end plate on the suction side is most effective in hindering the interaction of the tip vortex with the airfoil trailing edge at high angles of attack, and therefore the highest noise reduction can be achieved with this configuration. Placing the end plate on both sides of the surface has no further benefit regarding the noise reduction. As the present study contains results for a cambered NACA 4412 only, further measurements on other airfoil types need to be performed to investigate if these findings are sensitive to the airfoil type. However, recent results from Zhang et al. [7] show similar trends for the tip noise contribution of symmetric airfoils with varying thickness and cambered airfoils with varying camber from the NACA series (including the 4412), giving at least some validity that the current conclusions may basically also be valid for other airfoil types.
Conflict of interest
The authors declare no conflict of interest.
Acknowledgments
The authors thank Maarouf Hamadi (BTU) for his help with the acoustics measurements and Bilegt Selenge (TU) for his help with the hot-wire measurements. We acknowledge support by the German Research Foundation and the Open Access Publication Fund of TU Berlin.
References
- T.F. Brooks, D.S. Pope, M.A. Marcolini: Airfoil self-noise and prediction, NASA Reference Publication, 1989. [Google Scholar]
- A.R. George, F.E. Najjar, Y.N. Kim: Noise due to tip vortex formation on lifting rotors, AIAA Paper, 1980. [Google Scholar]
- Y. Guo: Aircraft flap side edge noise modeling and prediction, in 17th AIAA/CEAS Aeroacoustics Conference 2011 (32nd AIAA Aeroacoustics Conference), 05–08 June 2011, Portland, Oregon, USA, 2011, pp. 5–8. [Google Scholar]
- K.S. Rossignol: Flow field measurements to characterize flap side-edge noise generation, in 19th AIAA/CEAS Aeroacoustics Conference, 11–14 June 2001, Anaheim, CA, USA, 2013, p. 59. [Google Scholar]
- D.J. Moreau, C.J. Doolan, An experimental study of airfoil tip vortex formation noise, in 2nd Australasian Acoustical Societies Conference, ACOUSTICS 2016, vol. 2, 09–11 November 2016, Brisbane, Australia, 2016, pp. 1167–1176. [Google Scholar]
- D.J. Moreau, C.J. Doolan, W. Nathan Alexander, T.W. Meyers, W.J. Devenport: Wall-mounted finite airfoil-noise production and prediction. AIAA Journal 54, 5 (2016) 1637–1651. [CrossRef] [Google Scholar]
- T. Zhang, T.F. Geyer, C. de Silva, J. Fischer, C.J. Doolan, D.J. Moreau: Experimental investigation of tip vortex formation noise produced by wall-mounted finite airfoils. Journal of Aerospace Engineering 34, 6 (2021) 04021079. [CrossRef] [Google Scholar]
- A. Ebrahimi, R. Mardani: Tip-vortex noise reduction of a wind turbine using a winglet. Journal of Energy Engineering 144, 1 (2018) 04017076. [CrossRef] [Google Scholar]
- E. Schneehagen, T.F. Geyer, E. Sarradj, D.J. Moreau: Aeroacoustic noise reduction by application of end plates on wall-mounted finite airfoils. Experiments in Fluids 62, 5 (2021) 1–21. [CrossRef] [Google Scholar]
- E. Sarradj, C. Fritzsche, T.F. Geyer, J. Giesler: Acoustic and aerodynamic design and characterization of a small-scale aeroacoustic wind tunnel. Applied Acoustics 70, 8 (2009) 1073–1080. [CrossRef] [Google Scholar]
- E.W. Schneehagen, E. Sarradj, D. Gründemann, Design und Charakterisierung eines aeroakustischen Windkanals, in Fortschritte der Akustik – DAGA, Deutsche Gesellschaft für Akustik e.V. (DEGA), 2021. [Google Scholar]
- M. Awasthi, D.J. Moreau, C.J. Doolan: Flow structure of a low aspect ratio wall-mounted airfoil operating in a low Reynolds number flow. Experimental Thermal and Fluid Science 99 (2018) 94–116. [CrossRef] [Google Scholar]
- P. Welch: The use of fast Fourier transform for the estimation of power spectra: a method based on time averaging over short, modified periodograms. IEEE Transactions on Audio and Electroacoustics 15, 2 (1967) 70–73. [CrossRef] [Google Scholar]
- P. Sijtsma: Executive summary CLEAN based on spatial source coherence. International Journal of Aeroacoustics 6, 4 (2007) 357–374. [CrossRef] [Google Scholar]
- E. Sarradj, G. Herold: A Python framework for microphone array data processing. Applied Acoustics 116 (2017) 50–58. [CrossRef] [Google Scholar]
- E. Sarradj: A fast ray casting method for sound refraction at shear layers. International Journal of Aeroacoustics 16, 1–2 (2017) 65–77. [CrossRef] [Google Scholar]
- M.L. Albertson, Y.B. Dai, R.A. Jensen, Hunter Rouse: Diffusion of Submerged Jets. Transactions of the American Society of Civil Engineers 115, 1 (1950) 639–664. [CrossRef] [Google Scholar]
- E. Talboys, T.F. Geyer, F. Prüfer, C. Brücker: A parametric study of the effect of self-oscillating trailing-edge flaplets on aerofoil self-noise. Applied Acoustics 177 (2021) 107907. [CrossRef] [Google Scholar]
- J. Ffowcs Williams, L. Hall: Aerodynamic sound generation by turbulent flow in the vicinity of a scattering half plane. Journal of Fluid Mechanics 40 (1970) 657–670. [CrossRef] [Google Scholar]
- T.F. Brooks, M.A. Marcolini: Airfoil tip vortex formation noise. AIAA Journal 24, 2 (1986) 246–252. [CrossRef] [Google Scholar]
- T.F. Brooks, W.M. Humphreys: Flap-edge aeroacoustic measurements and predictions. Journal of Sound and Vibration 261, 1 (2003) 31–74. [CrossRef] [Google Scholar]
- B. Bai, D. Lin, X. Li: Identification of flap side-edge two-source mechanism based on phased arrays. AIAA Journal 60, 1 (2022) 249–260. [Google Scholar]
- S. Oerlemans: Wind turbine noise: primary noise sources, National Aerospace Laboratory NLR, 2011, pp. 1–57. [Google Scholar]
- D.J. Moreau, C.J. Doolan: Tonal noise production from a wall-mounted finite airfoil. Journal of Sound and Vibration 363 (2016) 199–224. [CrossRef] [Google Scholar]
- D. Angland, X. Zhang, N. Molin: Measurements of flow around a flap side edge with porous edge treatment. AIAA Journal 47, 7 (2009) 1660–1671. [CrossRef] [Google Scholar]
- K.B.M.Q. Zaman, A.F. Fagan, M.R. Mankbadi: An experimental study and database for tip vortex flow from an airfoil, in NASA Technical Memorandum, 2017. [Google Scholar]
- M.S. Genç, G. Özkan, M. Özden, M.S. Kiriş, Rahime Yildiz: Interaction of tip vortex and laminar separation bubble over wings with different aspect ratios under low Reynolds numbers. 232, 22 (2018) 4019–4037. [Google Scholar]
Appendix
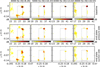 |
Figure A1 Third octave sound maps obtained at Re = 150,000 and 10° angle of attack, top baseline configuration, middle end plate pressure side, bottom end plate suction side, flow from left to right, black dotted line represents airfoil and wall, view on the suction side. |
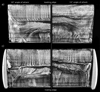 |
Figure A2 Surface flow visualization suction side NACA 4412 for Re = 150,000 and 10° (left) and 15° angle of attack (right), pictures are cut at half span and mirrored, flow from top to bottom, left side wall, right side free end, top: (a) baseline configuration, bottom: (c) end plate on the suction side. |
Cite this article as: Schneehagen EW. Geyer TF. & Sarradj E. 2022. Influence of end plate placement on the reduction of airfoil tip vortex formation noise. Acta Acustica, 6, 59.
All Figures
|
Figure 1 End plate geometries on NACA 4412 (grey), full circle with diameter corresponding to the chord length of 70 mm (green), half circle on suction side (blue), half circle on pressure side (red). |
| In the text | |
|
Figure 2 Acoustical measurement set up in aeroacoustic wind tunnel at BTU. |
| In the text | |
|
Figure 3 Measurement evaluation areas. |
| In the text | |
|
Figure 4 Velocity-scaled sound pressure levels integrated over whole airfoil for all configurations and flow speeds for different angles of attack. |
| In the text | |
|
Figure 5 Third octave sound maps obtained at Re = 150,000 and 15° angle of attack, top baseline configuration, middle end plate pressure side, bottom end plate suction side, flow from left to right, black dotted line represents airfoil and wall, view on the suction side. |
| In the text | |
|
Figure 6 Third octave sound pressure levels integrated over whole airfoil or only the tip region (according to Fig. 3a), between each flow speed 30 dB are added to avoid overlay. |
| In the text | |
|
Figure 7 Overall sound pressure level difference of integrated spectra between base configuration and end plate applied, St < 18 and f > 1 kHz, integration area whole airfoil (top) or only tip (bottom) according to Fig. 3a, blue indicates noise reduction and red increase, note different color-bars. |
| In the text | |
|
Figure 8 Turbulence intensity Tu, mean streamwise velocity U, mean upwash velocity W and turbulence intensity TuSt frequency filtered from St = 8 to St = 18, 15° angle of attack, Re = 150,000: baseline (left), end plate pressure side (middle), end plate suction side (right), (measurement plane located 0.1 chord lengths downstream of the airfoil (see Fig. 3b), white dashed line indicates trailing edge – vertical line indicates end plate (suction side above). |
| In the text | |
|
Figure 9 Surface flow visualization suction side NACA 4412 for Re = 150,000 and angle of attack 10°, flow from top to bottom, left side wall, right side free end, (a) baseline configuration, (b) end plate on the pressure side, (c) end plate on the suction side. |
| In the text | |
|
Figure A1 Third octave sound maps obtained at Re = 150,000 and 10° angle of attack, top baseline configuration, middle end plate pressure side, bottom end plate suction side, flow from left to right, black dotted line represents airfoil and wall, view on the suction side. |
| In the text | |
|
Figure A2 Surface flow visualization suction side NACA 4412 for Re = 150,000 and 10° (left) and 15° angle of attack (right), pictures are cut at half span and mirrored, flow from top to bottom, left side wall, right side free end, top: (a) baseline configuration, bottom: (c) end plate on the suction side. |
| In the text | |
Current usage metrics show cumulative count of Article Views (full-text article views including HTML views, PDF and ePub downloads, according to the available data) and Abstracts Views on Vision4Press platform.
Data correspond to usage on the plateform after 2015. The current usage metrics is available 48-96 hours after online publication and is updated daily on week days.
Initial download of the metrics may take a while.