Open Access
Figure 4
Download original image
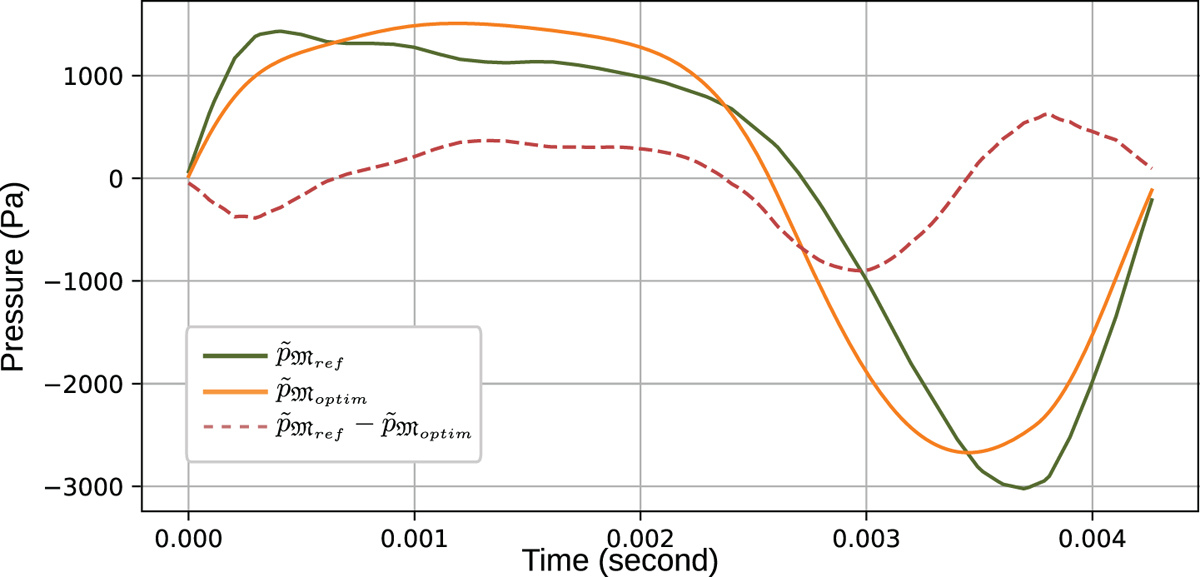
Typical waveform for the recorded signal (green) and for the signal obtained from optimized mask parameters (orange) as played by musician A2 on a Bb3. The difference between signals is drawn in dashed red. The relative RMS error is 0.28.
Current usage metrics show cumulative count of Article Views (full-text article views including HTML views, PDF and ePub downloads, according to the available data) and Abstracts Views on Vision4Press platform.
Data correspond to usage on the plateform after 2015. The current usage metrics is available 48-96 hours after online publication and is updated daily on week days.
Initial download of the metrics may take a while.