| Issue |
Acta Acust.
Volume 10, 2026
|
|
|---|---|---|
| Article Number | 28 | |
| Number of page(s) | 17 | |
| Section | Musical Acoustics | |
| DOI | https://doi.org/10.1051/aacus/2026025 | |
| Published online | 21 April 2026 | |
Scientific Article
Experimental investigation of lip-specific mouthpiece forces and pressure parameters in trombone performance under realistic playing conditions
1
Department of Music Acoustics – Wiener Klangstil, University of Music and Performing Arts Vienna, Vienna, Austria
2
Carinthia University of Applied Sciences, Villach, Austria
* Corresponding author: This email address is being protected from spambots. You need JavaScript enabled to view it.
Received:
11
November
2025
Accepted:
11
March
2026
Abstract
Mastering brass playing depends on the fine control of the embouchure–the coordinated interaction between lips, mouthpiece, and airflow. While teachers and performers have long emphasised this balance, objective data on how lip forces and pressures interact during real performance are scarce. This study addresses this gap by introducing a novel sensor-integrated mouthpiece system capable of directly capturing lip-specific forces together with mouthpiece and intraoral pressure signals during playing. Data from 31 trombonists, ranging from beginners to professionals, were synchronised with score annotations and analysed note by note. Distinct embouchure strategies emerged across proficiency levels: advanced and professional players maintained tighter control of total and differential lip forces, operated within narrower limits, and showed greater relaxation during rests. At note onsets, they exhibited smaller relative force surges and more balanced lip contributions, reflecting a potential refined motor coordination. These findings provide the first quantitative, lip-resolved evidence of force magnitudes, distributions, and efficiencies across skill levels, offering new perspectives for brass acoustics, pedagogy, and feedback-based training.
Key words: Embouchure / Mouthpiece force / Lip force distribution / Brass acoustics / Trombone performance
© The Author(s), Published by EDP Sciences, 2026
 This is an Open Access article distributed under the terms of the Creative Commons Attribution License (https://creativecommons.org/licenses/by/4.0), which permits unrestricted use, distribution, and reproduction in any medium, provided the original work is properly cited.
1 Introduction
Learning to play a brass instrument requires extensive practice. Controlling the embouchure and the performance parameters involved–such as the mouthpiece forces that enable the lips to vibrate freely while maintaining an airtight seal, or the precise pressure needed to initiate lip oscillation–is a complex skill that develops gradually over time. Performance parameters that are of considerable interest to various communities, from music education to acoustics, are the force applied to the mouthpiece when playing and the oral and mouthpiece pressure.
An area of interest for acousticians are the mechanical properties of the lips, which are difficult to measure experimentally, but which are influenced by the force of the mouthpiece [1, 2]. Studying the oscillatory (AC) component of the force provided insights into the acoustic behaviour of the lips [3]. Using a strain gauge on the upper lip and measuring the air pressure in the mouthpiece, Yoshikawa was able to detect outward-striking and, for higher registers, upward-striking oscillation [4]. Various experiments have demonstrated a positive correlation between mouthpiece force and both pitch and intensity, indicating that higher pitch and greater intensity require increased mouthpiece force [1, 5, 6]. Attempts to find correlations between the mouthpiece force used and the level of proficiency of a musician led to different results. For example, Barbenel’s study with 60 participants playing the trumpet showed no significant relationship between the force used and the experience of the musicians [5], while Petiot [1] could observe that advanced musicians exert less force. Bianco and colleagues investigated mouthpiece force in synergy with other performance variables, such as facial muscle activation and intra-oral pressure, with regard to motor controls [6]. Similar to theoretical studies [7], their experiments showed that different input variants of the performance variables in brass playing can lead to the same output. So, the sound did not change significantly despite inconsistencies in the force signal.
Within the pedagogical community, the force exerted on the mouthpiece and the role of ‘breathing’ in generating the necessary oral pressure remain topics of ongoing and often controversial debate [8–11]. On the one hand, there is a consensus that prolonged use of excessive mouthpiece force can negatively impact musicians’ health in the long term [12, 13]. On the other hand, similar to the debate over whether advanced musicians use less force than beginners, the optimal amount of force remains a subject of varying opinions across different playing methods. The debate about ‘force vs. no force’ goes back to the beginning of the 20th century and inspired the first quantitative recording of mouthpiece force [14]. Since then, support for using a minimum force to seal the mouthpiece and the lips has been found in many educational concepts [10]. In addition to the amount of the overall force, a pivoting movement can often be observed in brass musicians’ performances. This raises the question of the conditions under which the force is applied on the upper and lower lip [11, 15]. Lowell Little illustrates the concept of force distribution with statements such as: “Since the lower lip is more capable of muscular development, it is wise to allow the majority of the necessary mouthpiece pressure to rest on the muscular pad formed by the lower lip” [16].
Previous experimental studies on the subject of mouthpiece force analysed the total force exerted by the lips on the mouthpiece. The upper and lower lip load conditions have been addressed in the pedagogical literature but not by experimental data from musicians, which offers an intriguing field of research. Furthermore, there is a notable lack of studies examining the interrelationships among multiple performance parameters across a diverse group of musicians.
In this paper, experimental data of 31 trombonists of different levels of proficiency (beginners, advanced and professional musicians) is presented, including the performance parameters: mouthpiece force of the upper and lower lip, oral pressure and mouthpiece pressure. By analysing the forces exerted by the upper and lower lips, valuable insights can be gained into the playing techniques of musicians. A key focus of this study is the collection of data under conditions familiar to the musicians, such as at accustomed locations, using familiar musical excerpts, and employing a measuring device designed to minimally impact posture. To enable the acquisition of these parameters with minimal interference to the musician’s natural playing behaviour, a novel measuring device was developed [17–19]. The experimental data provide a foundation for further research in the fields of acoustics and brass instrument pedagogy.
2 Experimental setup and data processing
The separate measurement of upper- and lower-lip forces, combined with mouthpiece and intraoral pressure, necessitated the development and calibration of a dedicated sensor mouthpiece.
Performance data was collected from musicians with varying levels of proficiency as they played a defined musical passage. Alongside the sensor data, the audio signal was captured via a clip-on microphone to enable precise assignment of sensor events to musical notes. After the playing task, participants completed a short questionnaire.
The recorded sensor data was then processed and mapped to the corresponding notes using score-audio alignment between the audio recording and the MusicXML score. Finally, the dataset was subjected to statistical analysis.
2.1 Measuring device
Assessing the force exerted on the mouthpiece requires the installation of force sensors either between the mouthpiece and the instrument or directly on the mouthpiece. Adapters fitted with strain gauges or other force sensors provide accurate measurements and have been used in different studies [1, 20, 21]. However, they alter the relative position of the mouthpiece to the instrument, effectively changing the instrument’s length, its tuning and also forces musicians to adopt an unusual playing posture. To avoid this, all sensors were integrated into the mouthpiece, or specifically into the cup of a three-part mouthpiece (see Fig. 1).
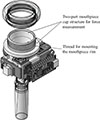 |
Figure 1. Mechanical structure of the sensor-integrated measurement device. |
To enable separate measurement of the forces exerted by the upper and lower lips, the mouthpiece cup is subdivided into a movable component and a fixed component [17], complemented by a dedicated carrier for the electronic components (see Fig. 2). The movable component is threaded to accommodate the screw rim and transmits the lip-induced forces acting at the rim to an array of underlying load cells. The movable and fixed components are connected in a form-fitting manner and mechanically decoupled by a soft two-component silicone seal. The seal ensures airtightness while permitting limited relative displacement of the movable component, thereby enabling effective force transmission to the load cells under the applied loading conditions. The silicone seal is embedded within a 0.2 mm design gap.
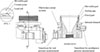 |
Figure 2. Front view and cross-sectional view of the measurement device, showing the mechanically fixed and movable parts, the sealing gap, and the locations of the pressure sensors used for oral and mouthpiece pressure measurements. |
In the initial design of the measurement device [17], three load cells were used, and the individual forces of the upper and lower lips were estimated by applying equilibrium conditions of forces and moments. This configuration, however, proved to be sensitive to measurement errors. Consequently, a fourth load cell was added in the revised design to improve robustness and force separation.
In the improved configuration, two load cells are assigned to each lip (see Fig. 3). For each lip, the two corresponding load cells are positioned symmetrically at an angle of 80° relative to the axis of symmetry between the upper and lower lip. This angle represents a compromise between improved differentiation of lip forces and geometric constraints arising from the integration of additional sensors, particularly the pressure transducers. Details on how the resulting load-cell signals are related to the upper- and lower-lip forces are provided in Appendix A. All electronic components, including the load cells, are housed within an electronics carrier module that is screwed onto the fixed part of the mouthpiece. The shaft connecting the mouthpiece to the instrument is also attached to the fixed part via a threaded connection.
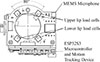 |
Figure 3. Top view of the electronic assembly, illustrating the arrangement of the load cells assigned to the upper and lower lips. |
The sensors used for force measurement are four Honeywell FMAMSDXX025WCSC3 cells, each with a measuring range of up to 25 N and an overforce limit of 75 N. A bidirectional AMSYS 5915 sensor is used to measure the oscillating air pressure in the mouthpiece cup, for which the air is passed through an internal channel in the cup to the sensor. To measure the air pressure in the oral cavity, a second AMSYS 5915 sensor is connected to a flexible tube, the end of which is guided into the oral cavity. As the measuring device is also intended to be used as a learning aid for brass musicians in the future, a vibration motor that enables haptic feedback, a MEMS microphone and an ICM-20948 MEMS motion tracking device are integrated, although their data was not used for the study. The data from the sensors can be transmitted at a sampling rate of approximately 1700 Hz to a computer that is connected with a cable. Bluetooth Low Energy and WIFI are also available as slower and less stable acquisition variants.
The primary challenge in the development of the measuring device was achieving a proper seal between the movable and fixed parts of the mouthpiece cup while simultaneously ensuring the accurate transmission of forces to the load cells. The best solution was found to be the injection of a low-viscosity two-component silicone into the sealing cavity.
To calibrate the force measurement, an initial test setup was developed in which the mouthpiece is placed on a scale (see the top panel of Fig. 4). A weight is attached to a custom adapter that applies force to defined regions of the mouthpiece rim, corresponding either to the upper- or lower-lip contact areas. By varying the position and orientation of the adapter, different force distributions can be realised. Using this setup, each of the three measuring devices constructed for the study was subjected to 50 measurements under different load configurations.
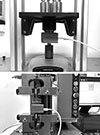 |
Figure 4. Top: Initial validation setup using a precision scale, with calibrated weights applied to the mouthpiece rim in different distribution patterns to compare the reference scale readings with the mouthpiece force sensor output. Bottom: Force measurement characterisation performed using a Zwick/Roell ZwickiLine Z020 universal testing machine under controlled and reproducible loading conditions. |
These measurements revealed a consistent systematic relative error of approximately −16%. This systematic deviation is primarily attributed to the mechanical resistance of the two-component silicone embedded in the sealing gap between the movable and fixed parts of the mouthpiece, which introduces an additional force component that is not directly captured by the load cells. While the compliance of the silicone seal influences the absolute force magnitude, it does not affect the relative force distribution between the upper and lower lips. To compensate for this systematic error while maintaining a simple and user-friendly workflow, a practical calibration procedure was developed. Prior to each measurement session, a 1 kg reference weight is placed on the rim of the mouthpiece. A calibration factor is then computed as the ratio between the known reference force and the force measured by the four load cells. After applying this linear correction, the experimental standard deviation of the relative random error [22] using the initial test setup was reduced to a range between 2% and 3.3%, depending on the specific measuring device (three devices were constructed for this study).
Following compensation of the systematic error using the 1 kg reference-weight calibration procedure described above, the force measurement system was further characterised and validated under controlled and reproducible conditions using a Zwick/Roell ZwickiLine Z020 universal testing machine (see the bottom panel of Fig. 4).
In this setup, the mouthpiece was subjected to a well-defined ramp force pattern, with the applied force increasing continuously from 1 N to 51 N (see Fig. 5). The load was applied either predominantly to the upper-lip contact area, predominantly to the lower-lip contact area, or in a balanced configuration engaging both regions simultaneously. To realise these different loading conditions, a silicone plate was positioned between the compression punch and the mouthpiece rim, either locally in the upper- or lower-lip contact region or covering the entire rim for balanced loading. However, even in the balanced loading configuration, slight force asymmetries may occur due to small variations in the positioning and alignment of the silicone plate and the compression punch. Accordingly, slight force asymmetries may be observed even under nominally balanced loading conditions, which can manifest as a small offset between the reconstructed force signals, as visible in Figure 5. The testing machine served as a high-accuracy reference system, enabling a direct comparison between the applied reference force and the forces derived from the calibrated load-cell signals.
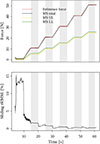 |
Figure 5. Comparison of force signals recorded during the Zwick/Roell testing machine validation test for the measuring device, including a time-resolved error measure. Top: Reference force measured by the Zwick/Roell ZwickiLine compression testing machine (red) and reconstructed forces from the mouthpiece measuring system (MS) for total force (black), upper-lip force (yellow), and lower-lip force (green). Grey shaded regions indicate quasi-static force plateaus detected from the reference signal. Bottom: Sliding-window relative root-mean-square error (rRMSE) between the total force recorded by the mouthpiece and the reference force, computed over a 0.2 s window, where the RMSE in each window is divided by the mean absolute reference force within the same window. |
The validation experiment allowed the remaining absolute and relative errors of the force reconstruction to be quantified over a broad force range relevant for embouchure measurements. In addition to dynamic ramp segments, quasi-static force plateaus were analysed separately in order to assess the steady-state accuracy and repeatability of the system.
The results of the validation demonstrated excellent agreement between the calibrated measuring device and the reference forces provided by the testing machine across all force channels (total force, upper lip, and lower lip). For the evaluation of relative errors, a minimum force threshold of 2 N was applied. This choice is further supported by the observation that none of the analysed notes in this study exhibited total mean forces below 2 N. Under these conditions, very high linearity was observed in all cases, with Pearson correlation coefficients exceeding r = 0.9999, indicating an almost perfectly linear correspondence between the reconstructed and reference forces over the investigated force range.
For the balanced force distribution condition, the mean relative error evaluated over all samples above 2 N was −1.39%, with a standard deviation of 2.26%. When the analysis was restricted to quasi-static force plateaus, the mean relative error was reduced to −0.71%, accompanied by a substantially lower standard deviation of 0.56%, indicating high steady-state accuracy and repeatability.
Comparable accuracy was observed for the upper- and lower-lip force distribution conditions, with plateau-based mean relative errors of approximately −1% and standard deviations below 1% in both cases.
Overall, the validation results indicate that, following systematic error compensation, the measuring device achieves relative force measurement errors on the order of 1%, with sub-percent standard deviations on quasi-static force plateaus. These findings confirm both the high accuracy and the high repeatability of the force reconstruction under mechanically stable, quasi-static loading conditions, in the relevant measuring range. As illustrated in Figure 5, the relative root-mean-square error (rRMSE) increases markedly in the low-force region, in particular during the 1 N force plateau. This behaviour is expected, as relative error metrics become increasingly sensitive at low force levels, where small absolute deviations and compliance effects lead to disproportionately large relative errors. At higher force levels, corresponding to the typical operating range of embouchure measurements, the rRMSE remains low and stable.
The limitations of the measuring system, when compared to systems placed between the mouthpiece and the instrument, include reduced measuring accuracy. However, changes in the vertical positioning of the mouthpiece relative to the lips (i.e. a higher or lower mouthpiece position) have only a limited impact on the force distribution detected by the sensors located beneath the rim of the mouthpiece. This is because the curved shape of the jaw, in contrast to the straight rim of the mouthpiece, ensures that forces are still effectively transmitted to both the upper and lower sensors.
When measuring air pressure in the oral cavity and mouthpiece, several technical challenges may occur. Water droplets can infiltrate the pressure sensors, temporarily disrupting the signal and requiring targeted cleaning steps during preprocessing. In addition, the tongue may intermittently block the intraoral measuring tube. To mitigate this, a perforated tube design at the distal end has proven effective, as it reduces the risk of occlusion and ensures more stable and reliable pressure acquisition.
2.2 Data acquisition procedure
In the study presented, participants were instructed to play various predefined tone sequences, single tones, and melodies using the mentioned freshly calibrated measuring device, a mouthpiece equipped with integrated sensors. These sensors measured the force exerted by the upper and lower lips as well as the oscillating air pressure in the mouthpiece and the oral cavity, while the audio signal was captured using an external clip microphone (Shure BETA 98H/C). To ensure participant safety, the measuring mouthpiece was disinfected before and after each use, and a sterile disposable tube was utilised for measuring air pressure in the oral cavity, effectively minimising health risks. Prior to the recording session, participants were provided with detailed information about the study and asked to give written consent for the anonymised collection of their data, in accordance with the ethical guidelines outlined in the 2013 Declaration of Helsinki [23]. Following this, they were given 10 min to familiarise themselves with the measuring mouthpiece while playing their instrument. Typically, musicians use their individual mouthpieces, which are tailored to their specific preferences and dimensions. To ensure the measuring setup closely aligns with each musician’s personal preferences, a selection of interchangeable mouthpiece rims and shanks was provided, allowing for customisation.
At the end of the session, participants were asked to complete a questionnaire. The entire data acquisition process was designed to take approximately 45 min and was accompanied by a protocol to record additional relevant information.
The provided sheet music is divided into three sections of varying difficulty levels. Each section features note sequences that vary in pitch, note length, dynamics, and articulation. In addition to technical exercises, the sheet includes well-known melodies, such as an excerpt from Concertino for Trombone by Ferdinand David, as shown in Figure 6, Part 3.
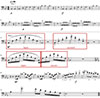 |
Figure 6. Excerpt from Part 1 (easy) and Part 3 (difficult) of the provided musical score, featuring well-known technical and melodic passages. Red highlighted segments indicate different articulation styles (legato, accented, staccato). |
The questionnaire includes demographic questions as well as specific inquiries about the participants’ musical experience and their corresponding level of expertise. Additionally, it addresses detailed aspects of each musician’s embouchure, such as preferred registers, the perceived amount of mouthpiece force, and any changes in mouthpiece position when transitioning between pitches (the questionnaire is provided as supplementary material in the associated Zenodo repository).
2.3 Data preparation and analysis
For the analysis, three raw datasets were available after data acquisition, each requiring processing: (1) sensor data recorded using the measuring device at an approximate sampling frequency of 1750 Hz, (2) audio recordings in .wav format with a sampling frequency of 44.1 kHz, and (3) quantitative and qualitative data from questionnaires.
To enable a detailed analysis, it was crucial to accurately align the sensor data with the corresponding notes in the sheet music, each annotated with specific note descriptors. A purely Dynamic Time Warping (DTW)-based alignment process was not feasible due to the significant variation in the musicians’ skill levels. Therefore, the alignment process was divided into four steps: (a) approximated Memory-Restricted Multiscale Dynamic Time Warping (MrMsDTW) alignment, (b) manual refinement, (c) and merging the audio alignment with the sensor dataset.
The process began by synchronising the audio recordings with the original .musicxml sheet music using the MrMsDTW procedure [24], implemented via Müller’s Sync Toolbox [25]. This method, an advanced variation of the DTW algorithm, provided an initial alignment. However, due to significant variations in tempo and note quality, manual refinement of note onsets and durations was necessary. This refinement was performed using Sonic Visualiser.
Finally, the score-audio alignment data was integrated with the sensor dataset. Prior to alignment, the raw sensor signals were preprocessed in MATLAB (Signal Processing Toolbox). Preprocessing included zero-phase Butterworth filtering (implemented using forward–backward filtering via filtfilt) and envelope extraction. The mouthpiece pressure was band-pass filtered using a Butterworth filter (order N b = 10) with cut-off frequencies of 50–800 Hz, whereas the oral pressure and lip-force signals were low-pass filtered using a Butterworth filter (order N = 4) with a cut-off frequency of 800 Hz. The onset of the first note in the sensor data was then identified by analysing the fundamental frequency and the envelope of the mouthpiece pressure signal. Once the first note’s onset was determined, the alignment information was synchronised with the sensor data using the corresponding timestamp. The forces exerted by the upper and lower lips were derived from the four axial load-cell signals integrated into the mouthpiece (see Appendix A). Two load cells were assigned to each lip, and the lip-specific axial force was obtained by summing the outputs of the corresponding sensor pair, under the geometric and quasi-static assumptions detailed in the appendix. Accordingly, the upper-lip force F UL and lower-lip force F LL were computed as
 (1)
(1)
where F 1, …, F 4 denote the individual load-cell measurements. The measurement assembly is compact and mechanically well constrained, and although it is manufactured from glass-fibre-reinforced PA11, no resonance-related artefacts are observed within the frequency range relevant to this study. Consequently, inertial effects and dynamic load redistribution between sensors are assumed to be negligible, and the system is treated as a lumped structure for the purpose of reconstructing F UL and F LL.
Following the preprocessing of the performance data, we used the statistical programming language R for feature extraction and statistical analysis. Data manipulation and preprocessing were performed using the dplyr and tidyr packages, while participant-level and note-level datasets were stored in structured data frames and lists. Descriptive and inferential analyses, including analysis of variance (ANOVA) were conducted with functions from the stats package (base R function). Linear and generalised linear mixed-effects models were fitted using the lme4 and lmerTest packages, which enabled the inclusion of random effects and Type III ANOVA with Satterthwaite’s method for degrees of freedom estimation. Post-hoc comparisons and estimated marginal means were computed using the emmeans package.
Graphical representations such as boxplots and line graphs were generated using base R functions from the standard stats and graphics packages, whereas the scatter plot and pie chart were created using the ggplot2 package.
Participant-level features were stored in a data frame, where each row represented a participant and included metrics such as mean force values for different note ranges and difficulty levels, force distribution metrics, and articulation-specific force values. Additionally, the quantitative questionnaire data were encoded using a predefined codebook and integrated into the data frame. Note-level features were stored in a list, where each element corresponded to a participant and contained a data frame of note-specific metrics, including fundamental frequency, force ratios, pressure metrics, and transient response times. These features were systematically initialised and computed to ensure consistency across participants and notes, enabling direct comparison of individual musical notes across all test subjects.
2.4 Study population
The study included 31 trombonists with varying levels of expertise, comprising 9 females and 22 males. Participation was restricted to adults, with the age distribution as follows: 29% were aged 18–23, 19.4% were aged 24–29, 16.1% were aged 30–35, 9.7% were aged 36–45, and 25.8% were over 45 years old. To assess expertise levels, data from the questionnaires were used to calculate a weighted proficiency score on a scale from 0 to 6, with higher scores indicating greater proficiency. This classification was based on several factors: a self-assessment of progress, ranging from beginner with basic knowledge to full-time musician, divided into six levels; experience in various roles such as orchestra member, soloist, or teacher; the number of years spent learning the instrument, distinguishing between those with less than or more than five years of experience; the daily time dedicated to practice; and the ability to perform musical excerpts categorised as easy, medium, or hard. To allow for group-level comparisons, participants were categorised into three proficiency levels based on a composite proficiency score. Although the boundaries between proficiency levels are not absolute, the classification was based on predefined score ranges: values from 0 to 2 were assigned to the beginner group, scores between 2 and 4.5 to the advanced group, and scores above 4.5 to the professional group. According to these criteria, the sample comprised 14 beginners, 10 advanced players, and 7 professional musicians. The resulting ungrouped proficiency distribution is shown in Figure 7.
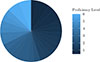 |
Figure 7. Distribution of proficiency levels among all participants, categorised by results of the questionnaire. |
3 Experimental results
The aligned experimental data facilitate precise comparisons of embouchure parameters across musicians with respect to specific pitches, articulation types, and other performance characteristics. Figure 8 shows a representative excerpt performed by participant 31, covering a pitch range from Bb2 to Bb4 with accented articulation. The figure displays the increasing lip force of the upper (yellow) and lower (green) lips, the intraoral pressure (red), and the acoustic pressure fluctuations in the mouthpiece (blue). For the final note, the intraoral pressure curve exhibits a brief irregularity that suggests a short-lived constriction affecting the measurement of intraoral pressure. The proband numbering remains consistent throughout this publication and is ordered according to ascending levels of playing proficiency.
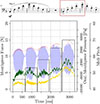 |
Figure 8. Plot of the aligned data recorded by the measuring device during an ascending note sequence performed by participant 31. The data includes oral pressure (red), mouthpiece pressure (blue), lower lip force (green), upper lip force (yellow), and MIDI pitch (black). |
3.1 General trends in mouthpiece force and force distribution
The following section presents the mouthpiece forces exerted by the upper and lower lips, both as absolute values and as relative proportions, reflecting the distribution of force between the lips during playing. To account for fluctuations in mouthpiece force, particularly prominent at the onset and offset of notes, the analysis was restricted to the middle 60% of each note’s duration. The mean force within this central window was then used for further evaluation. To account for differences in individual dynamic interpretation and overall loudness, a normalised lip force was additionally computed. This measure relates the mean force of each lip to the RMS mouthpiece pressure within the same central note window and includes a reference area A ref solely as a scaling factor, yielding a dimensionless quantity. In the present context, A ref does not correspond to a specific physical surface of the mouthpiece system, but was introduced to improve the readability and comparability of the resulting values:
 (2)
(2)
where the reference area was set to A ref = 10−3 m2.
To compare mouthpiece forces during playing, Figure 9 shows the absolute (top panel) and normalised (bottom panel) forces exerted by the upper and lower lips across all 31 participants, ordered by ascending level of proficiency. The data are based on all notes from Part 1 of the provided note sheet, representing the “easy” section. This segment includes pitches ranging from B♭2 to B♭3 and features variations in dynamics, as well as both melodic and technical passages.
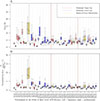 |
Figure 9. Comparison of mouthpiece forces across all participants, ordered by level of proficiency (left: beginners; right: professional musicians). (A) Absolute mean mouthpiece force of the upper (lighter colour) and lower (darker colour) lips. (B) Corresponding normalised mean mouthpiece force, computed separately for each lip as |

For participants who were also able to perform Part 3–the most challenging section–an additional boxplot is displayed in the background to enable direct comparison between the two difficulty levels. Part 3 extends the pitch range up to B♭4 and incorporates a variety of dynamic levels. Each participant is represented by two boxplots: the lighter (left) box indicates the force exerted by the upper lip, while the darker (right) box represents the force exerted by the lower lip. To characterise differences in force distribution during playing, participants were further categorised into three types based on the median force ratio between the lips. Upper-lip dominance (red) is defined by a median upper-lip force exceeding the lower-lip force by more than 10%. Lower-lip dominance (blue) reflects the inverse pattern, with more than 10% greater force on the lower lip. Cases falling within ±10% difference are classified as balanced force distribution (yellow).
A comparison of the forces exerted by different musicians performing the same musical material reveals considerable variability. In the easy excerpt, the total mouthpiece force ranged from 2.3 N to 51.5 N (with Fig. 9 presenting the total force separated into upper- and lower-lip components), while the corresponding normalised total force spanned values from 1 to 35. No significant correlation was observed between proficiency level and total mouthpiece force. When accounting for differences in loudness by normalising the lip forces with respect to the RMS mouthpiece pressure, no statistically significant group differences were observed either; however, the results indicated a tendency towards a proficiency-related ordering, suggesting that normalisation increases sensitivity to potential systematic effects without providing evidence for a significant group separation. By comparing the top and bottom panels of Figure 9, with particular focus on the background shading corresponding to the hard section, it becomes apparent that mouthpiece force is strongly influenced by dynamic level. While the absolute forces observed in the easy section are generally lower than those in the hard section, this difference largely disappears after normalisation.
Pronounced variability was observed within the beginner group, whereas such differences were less evident among advanced and professional musicians. For example, one participant exhibited a median total force–defined as the median of the sum of upper and lower lip forces across all played notes (see Eq. (3))–that was 7.5 times greater than that of the subject with the lowest measured force.
 (3)
(3)
Here, FUL and FLL denote the forces exerted by the upper and lower lips, respectively, and j = 1, ⋯, 103 corresponds to the notes included in Part 1 of the exercise. However, even assuming that Part 1 poses a comparable challenge for beginners as Part 3 does for professional musicians, several beginners exhibit mouthpiece forces that clearly exceed those of the professionals for Part 3. A comparison between self-assessed and objectively measured mouthpiece force at the individual level yields a correlation coefficient of r = 0.23, indicating that the perceived force corresponds only weakly to the actual values. For example, on an open scale from 0 to 1 (where 0 indicates very low and 1 very high perceived force), respondent P6 rated themselves at 0.75, while some participants with objectively low force output rated themselves at the maximum value of 1.
To examine the influence of articulation on lip force, an analysis was conducted on data from the ten musicians (Participants 22–31) who were able to perform the required passages with all articulation types. Separate one-way analyses of variance (ANOVAs) were carried out for the mean upper- and lower-lip forces, with articulation type (legato, accented, staccato) as the categorical factor. For the lower-lip forces, a significant main effect of articulation was observed (F(2, 608)=5.19, p = 0.006), where the F-statistic quantifies the ratio of between-condition variance to within-condition variance and p denotes the corresponding probability under the null hypothesis. Post hoc pairwise comparisons using Tukey’s honestly significant difference (HSD) test revealed that staccato articulation resulted in significantly higher lower-lip forces than legato playing (p = 0.006). No other pairwise contrasts (legato–accented or staccato–accented) reached statistical significance. For the upper-lip force, no significant main effect of articulation was found.
These results indicate that, under identical dynamic specifications and within the examined natural tone series, articulation type influences mouthpiece force primarily through increased lower-lip exertion during staccato playing. In contrast, other articulation differences do not exhibit systematic effects on mouthpiece force. It should be noted that the restricted sample size limits statistical power and the generalisability of these findings.
While articulation exerted only a minor influence on mouthpiece force, a strong effect of pitch register was observed. Using the same subset of participants as before (Participants 22–31), separate one-way analyses of variance were conducted for the mean upper-lip force, mean lower-lip force, and mean total lip force, with pitch register as a categorical factor comprising four levels (high register, upper middle register, lower middle register, low register). All three analyses revealed a highly significant main effect of pitch register. For the mean total force, this effect amounted to F(3, 2175)=371.47 with p < 0.001.
Post hoc Tukey HSD tests confirmed that all pairwise comparisons between the four pitch-register groups-hiRan (high register: > F4), himiRan (upper middle register: ≤F4, > B♭3), lomiRan (lower middle register: ≤B♭3, > B♭2), and loRan (low register: ≤B♭2)-were statistically significant for both upper- and lower-lip forces (all p < 0.001). Mouthpiece force increased systematically with pitch register, with the highest forces observed in hiRan and the lowest in loRan. These findings provide robust evidence that embouchure force strongly depends on pitch register, consistent with previous reports [1, 5].
Differences in the relationship between force and dynamics can be observed across different pitches and subjects when considering sustained tones shaped by a messa di voce, i.e., a dynamic swelling and fading on a single pitch. Figure 10 illustrates an example for pitch F4, performed with a crescendo from piano to forte, followed by a decrescendo back to piano. As intensity increases, the total applied force tends to rise, as reflected in higher force levels at the upper and lower lips.
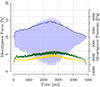 |
Figure 10. Mouthpiece force and pressure during an F4 note performed with a dynamic crescendo from piano to forte and a decrescendo back to piano. The data shown correspond to Participant 31 (P31). The plot includes the mouthpiece pressure (blue), the RMS of the mouthpiece pressure (dark blue), the force exerted by the lower lip (green), and the force exerted by the upper lip (yellow). |
While certain musicians-such as participant 31-exhibit a clear positive relationship between total mouthpiece force and playing intensity, as illustrated by the swell note in Figure 10, others maintain a relatively constant total force despite pronounced changes in intensity during crescendo and decrescendo passages. Still others show no change at lower pitches but a marked increase in force at higher ones. The influence of intensity on the mouthpiece force can therefore vary greatly at the inter-individual level.
Setting aside the absolute magnitudes of the forces and focusing instead on their distribution between the upper and lower lips, all three embouchure strategies (dominant upper, dominant lower and balanced distribution) are represented in Figure 9 in all proficiency groups. This suggests that effective results can be achieved using different technical approaches. The categorisation is based on the average force distribution calculated across all notes in Part 1. However, a closer examination that includes data from Part 3 reveals changes in dominant force type for certain individuals. For example, test subject 25 shifts from an upper-lip dominant to a lower-lip dominant pattern (see panel A in Fig. 9). This highlights the need to investigate the influence of pitch on force distribution, as Part 3 contains considerably higher notes compared to Part 1.
To better depict the variability in individual playing strategies, a normalised force ratio RF is introduced. This ratio ranges from −1 (indicating 100% lower-lip and 0% upper-lip force) to +1 (indicating 100% upper-lip and 0% lower-lip force).
 (4)
(4)
The top panel boxplot in Figure 11 compares the normalised force ratio of all musicians, taking into account all the notes played by each subject. The transparent background colour red – blue and yellow corresponds to the separation of the distribution types in relation to Figure 9. Many of the musicians-regardless of their level of proficiency-employ a range of force distributions, including both upper-lip-dominant and lower-lip-dominant types. More widely spaced quartiles indicate greater variability in embouchure configuration, likely reflecting adjustments in jaw position or mouthpiece orientation relative to the head. When examining the full range of notes performed by the musicians (from Part 1 to Part 3), no major differences in force distribution are apparent. When focusing specifically on the notes from the easier section (see Appendix B, Fig. B.1), there is a noticeable tendency-apart from a few outliers-for advanced and professional musicians to display a smaller interquartile range, indicating more consistent force application.
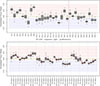 |
Figure 11. Box plots of the normalised force ratio between upper and lower lips. The top panel shows data across all notes for all participants; the bottom panel focuses on participants P22 to P31 across different pitch registers (loRan – low register: ≤B♭2; lomiRan – lower middle register: ≤B♭3 and >B♭2; himiRan – upper middle register: ≤F4 and >B♭3; and hiRan – high register: >F4). Positive values indicate greater upper-lip force, negative values indicate greater lower-lip force. Background colours denote force distribution types: red for upper-lip dominance, blue for lower-lip dominance, and yellow for balanced distribution. |
The bottom panel of Figure 11 shows how musicians adapt their force distribution in response to pitch changes. Interestingly, no uniform pattern emerges, despite all participants from P22 to P31 being highly advanced. Instead, individual differences are evident. For example, P27 and P29 show a clear increase in lower-lip force as pitch ascends, while P23, P24, and P31 exhibit the opposite trend, relying more on the upper lip at higher pitches. Nevertheless, the force ratios remain relatively stable across pitch ranges, especially in the higher registers.
3.2 Intra-individual repeatability of the same musical task
To assess intra-individual repeatability, mean lip forces extracted from the central 60% of each note’s duration were compared between two repetitions of Parts 1–3 performed by the same professional musician (n = 232 notes). The following repeatability analysis was limited to one musician, as a broader analysis was not feasible within the scope of the present study due to the substantial preprocessing effort required for data preparation.
The mean upper-lip force showed excellent repeatability, with no significant difference between repetitions (paired t-test, p = 0.93), a very strong correlation (r = 0.96), and a negligible effect size (d z = 0.01). The mean lower-lip force likewise exhibited a very strong note-wise correspondence between repetitions (r = 0.99), indicating highly consistent force modulation across notes; however, a significant systematic offset was observed (mean difference ≈223 mN, p < 0.001, d z = 0.67). This offset corresponds to approximately 2–3% of the absolute force magnitude and may therefore be partly attributable to the relative measurement uncertainty discussed in Section 2.3, in addition to potential changes in embouchure setup or playing effort. Notably, the second repetition exhibited consistently higher lower-lip forces, which may reflect increased physical demand associated with prolonged playing. Figure 12 further illustrates the relatively high consistency between the two repetitions by presenting a short performance excerpt, with the first repetition shown in the top panel and the second repetition shown in the bottom panel.
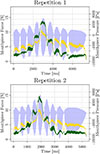 |
Figure 12. Comparison plot illustrating intra-individual repeatability for a single musician performing the same note sequence twice (top: repetition 1, bottom: repetition 2). The signals shown are mouthpiece pressure (blue), upper-lip force (yellow), and lower-lip force (green). |
To further account for differences in acoustic output between repetitions, the mean total lip force (sum of upper- and lower-lip forces) was additionally normalised by the RMS mouthpiece pressure on a per-note basis, using the same central 60% analysis window of each note. The resulting normalised total force retained a strong note-wise correspondence between repetitions (r = 0.94), while exhibiting only a small systematic offset (paired t-test, p < 0.001, d z = 0.26). The small effect size indicates that the magnitude of this offset is minor relative to the note-to-note variability and that the strong correspondence between repetitions is preserved.
3.3 Group differences in mouthpiece force patterns
Although Figure 9 shows no statistically significant differences in exerted force between proficiency levels, several outliers can be identified among the beginners that are not observed in advanced or professional musicians within the same note context. In particular, beginners display both higher maximum and lower minimum force values. Specifically, 4 of the 14 beginners exceeded the maximum force observed in the advanced and professional groups for both the lower and upper lip, while 3 fell below the minimum force of the lower lip, and one fell below the minimum force of the upper lip. The results indicate that advanced and professional musicians remain within stable upper and lower force limits, whereas beginners occasionally exceed these boundaries. This suggests that such limits may represent reference ranges that could guide beginners in avoiding excessive or insufficient force application. Notably, the observation of a lower force limit contrasts with pedagogical approaches that emphasise playing with minimal or almost no mouthpiece force. Instead, the data imply that even highly skilled musicians maintain a certain baseline of lip force, underscoring the necessity of controlled-not minimised-pressure for stable tone production.
While the shown mouthpiece force data provide insight into the sustained portions of the notes, the focus on onsets gives additional information. Figure 13 compares three consecutive B♭2 notes performed by a beginner and a professional musician. In the beginner performance (upper panel), pronounced force peaks are evident at the beginning of each note, whereas in the professional performance (lower panel), the force curve remains relatively stable and even.
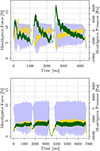 |
Figure 13. Comparison plot of a beginner (top) and a professional musician (bottom) performing the same notes. The data display mouthpiece pressure (blue), lower-lip force (green), and upper-lip force (yellow). |
Analysis of the ratio between the mean force during the first 20% of each note (onset phase) and the mean force during the sustained portion (Ronset = F onset/F middle), computed for all musicians and all notes of the same musical material (Part 1), revealed clear group- and lip-related differences. The dependent variable was Ronset, computed separately for the upper and lower lip for each note (j = 1, …, 103). A linear mixed-effects model was fitted with proficiency group (beginner, advanced, professional), lip (upper, lower), and their interaction as fixed effects, allowing both lips to be analysed within a single statistical framework:

Here, probandID denotes a globally unique participant identifier and is not coded within proficiency group. Although each participant belonged to exactly one proficiency group, the participant IDs were unique across the full sample and had no structural relation to group membership. The random intercept term therefore accounts for repeated note-level observations within each participant and for inter-individual differences in baseline onset ratios. An alternative model formulation with explicit nesting was also examined and yielded numerically identical fixed-effect estimates, indicating that the original specification adequately represented the data structure. Type III tests with Satterthwaite-approximated degrees of freedom revealed a significant main effect of proficiency group (F(2, 27.57)=3.70, p = 0.038), a main effect of lip (F(1, 5569.57)=8.27, p = 0.004), and a strong proficiency group × lip interaction (F(2, 5569.57)=51.76, p < 0.001). Fixed-effects estimates further indicated that, relative to beginners, advanced players exhibited lower onset ratios on average (estimate = − 0.077, p = 0.005), with an even greater reduction observed in professional musicians (estimate = − 0.149, p < 0.001). Across all participants, the upper lip contributed significantly less relative force at note onsets than the lower lip (estimate = − 0.097, p < 0.001). However, this lip effect depended on proficiency level: compared to beginners, advanced (+0.085, p < 0.001) and professional musicians (+0.152, p < 0.001) showed higher relative upper-lip involvement at note onsets, indicating that the pronounced tendency of beginners to initiate notes with comparatively greater lower-lip force diminishes with increasing expertise.
Taken together, these findings suggest that experienced musicians not only reduce the relative force at note onset (as reflected by a smaller onset-to-sustain force ratio) but also distribute this force more evenly between the upper and lower lip. In contrast, beginners tend to rely more heavily on the lower lip when initiating a note. While the analyses presented so far have focused on forces during note production, the forces exerted during the rests between notes are likewise relevant. Inspection of the data (e.g., Fig. 13) indicates systematic differences in rest-related mouthpiece forces between proficiency groups. To examine these differences quantitatively, a further linear mixed-effects analysis was conducted on the total mean mouthpiece force exerted during rest phases within the same played musical section across all participants. The dependent variable was the mean total lip force during rest phases, and the proficiency group (beginner, advanced, professional) was included as a fixed effect. A random intercept for participant was incorporated to account for repeated rest observations within individuals. The analysis revealed a significant main effect of proficiency group on rest-related mouthpiece force (F(2, df ≈ 27.8)=9.21, p < 0.001). Post hoc comparisons indicated that beginners exerted substantially higher forces during rests than both advanced and professional musicians. Relative to beginners, advanced players showed an average reduction of approximately 2.5 N (p = 0.006), while professional players exhibited a reduction of approximately 2.8 N (p = 0.005). The analysis was restricted to the easy note section (Part 1), which contained quarter-note rests between adjacent notes and ensured comparable rest durations across participants.
4 Discussion
This study provides quantitative measurements of mouthpiece forces in brass playing under realistic playing conditions, enabling a detailed view of how upper and lower lips contribute to tone production. Previous work measured only the total mouthpiece force [1, 5, 6], leaving pedagogical claims about force distribution largely untested. By separating upper and lower lip contributions, we demonstrate that force application strategies differ not only across proficiency levels but also within individuals depending on register and articulation.
A major outcome of this study is that musicians employ different strategies for distributing forces between the upper and lower lips, with distinct force distribution types observable across all proficiency levels. Each player exhibits an individual approach to adjusting this distribution across registers, and despite substantial inter-individual variability, musicians appear to rely consistently on their preferred strategy. This consistency is reflected in the relatively small interquartile range of the normalised force ratio between upper and lower lip across pitch registers, as shown in the bottom panel of Figure 11. It should be noted that each participant performed on their own instrument; while the influence of instrument differences is expected to be small, this factor warrants systematic investigation in future work.
Another key finding is that advanced and professional players remain within relatively stable force boundaries, whereas beginners occasionally exceed both upper and lower limits. This supports long-standing warnings against “excess pressure” [9, 12], while also demonstrating that even skilled players consistently maintain a baseline of mouthpiece force. The existence of such lower limits stands in contrast to pedagogical approaches advocating “no pressure” playing [14], and instead points to the importance of controlled rather than minimised force for stable tone production. The need for at least a minimal amount of pressure has been emphasised by pedagogues such as Frederiksen [26] and Reinhardt [15]. Our data further show that some beginners occasionally fell below lower limits used by more experienced players, despite still being able to seal their lips with the mouthpiece. This finding calls into question the principle that mouthpiece force should be reduced to the absolute minimum, and instead supports the view that a certain baseline of controlled force is essential for reliable embouchure function. As Philip Farkas emphasised, “There should be a comfortable normal pressure, which hermetically seals the lips to the mouthpiece-a pressure which keeps the mouthpiece from skidding around on the lips and gives a general feeling of security” [9].
Focusing on note onsets, beginners exhibited pronounced force spikes, particularly on the lower lip, whereas experienced players maintained a lower onset-to-sustain force ratio, resulting in a more gradual and consistent force profile throughout the tone. These findings highlight that not only the average force applied to specific notes is relevant, but also the consistency of force during tone production.
Finally, the observation of reduced residual forces during rests in advanced and professional musicians indicates greater relaxation and fine motor control, an ability that may contribute to endurance and injury prevention. Support for this can be found in the brass pedagogical methods of Stamp [27].
Taken together, these results bridge acoustical, physiological, and pedagogical perspectives. They show that although total mouthpiece force alone does not reliably distinguish proficiency levels, the pattern of force distribution between the lips and the control of force transients during note onsets offer more informative indicators of embouchure development.
Acknowledgments
This study was supported by the Austrian Research Promotion Agency (FFG) under the BRIDGE program (project number FO999903647). The participating musicians were recruited with the kind support of the Gustav Mahler Private University for Music (Klagenfurt), the Anton Bruckner Private University (Linz), and the Kärntner Landesmusikschulwerk. Their cooperation enabled the inclusion of a diverse sample of trombonists representing multiple proficiency levels. The development of the measurement apparatus was supported by the mouthpiece manufacturer Breslmair. For translation and language editing, ChatGPT 5.0 (OpenAI) and DeepL were used in addition to manual revision by the authors. The authors thank the anonymous reviewers for their constructive comments and valuable suggestions.
Conflict of interest
The authors declare no conflict of interest.
Data availability statement
The datasets generated and analysed during this study are openly available in the Zenodo repository at https://zenodo.org/records/18679877.
Author contribution statement
Conceptualisation – P.A.; Methodology – P.A.; Data analysis – P.A.; Funding acquisition – P.A.; Writing – original draft, P.A.; Supervision – V.C., P.N.; Writing – review and editing, all authors.
References
- J.F. Petiot: Measurement of the force applied to the mouthpiece during brass instrument playing, in: Proceedings of the Stockholm Music Acoustics Conference, 2003. [Google Scholar]
- C. Vergez, X. Rodet: Trumpet and trumpet player: model and simulation in a musical context, in: International Conference on Mathematics and Computing, 2001. URL: https://api.semanticscholar.org/CorpusID:35921599. [Google Scholar]
- S. Yoshikawa: On the modeling of self-oscillation in brass instruments. Journal of the Acoustical Society of America 84, 11 (1988) S161. [Google Scholar]
- S. Yoshikawa: Acoustical behavior of brass player’s lips. Journal of the Acoustical Society of America 97, 3 (1995) 1929–1939. [Google Scholar]
- J.C. Barbenel, P. Kenny, J.B. Davies: Mouthpiece forces produced while playing the trumpet. Journal of Biomechanics 21, 5 (1988) 417–424. ISSN 00219290. [Google Scholar]
- T. Bianco, V. Freour, I. Cossette, F. Bevilacqua, R. Causse: Measures of facial muscle activation, intraoral pressure and mouthpiece force in trumpet playing. Journal of New Music Research 41, 1 (2012) 49–65. [CrossRef] [Google Scholar]
- T. Hélie, C. Vergez, J. Lévine, X. Rodet: Inversion of a physical model of a trumpet, in: Conference on Decision and Control 1999. Vol. 3, 1999, pp. 2593–2598. ISBN 0-7803-5250-5. [Google Scholar]
- J.-B. Arban: Arban’s Complete Conservatory Method: for Trumpet (Cornet). Carl Fisher, New York, 1936. [Google Scholar]
- P. Farkas: The Art of Brass Playing. Brass Publications, Bloomington, 1962. [Google Scholar]
- J. Ford III: Scientific characterization of trumpet mouthpiece forces in the context of pedagogical brass literature. Ph.D. thesis, University of North Texas, University of North Texas, 2007. [Google Scholar]
- S.J. Miles: Dispelling the myths of the brass wind embouchure: methods, mechanics and practices. Ph.D. thesis, University of Otago, University of Otago, 2019. URL: https://hdl.handle.net/10523/9730. [Google Scholar]
- L. Borchers, M. Gebert, T. Jung: Measurement of tooth displacements and mouthpiece forces during brass instrument playing. Medical Engineering & Physics 17, 8 (1995) 567–570. ISSN 13504533. [Google Scholar]
- K. Kula, H.Z. Cilingir, G. Eckert, J. Dagg, A. Ghoneima: The association of malocclusion and trumpet performance. Angle Orthodontist 86, 1 (2016) 108–114. [Google Scholar]
- H.W. Henderson: An experimental study of trumpet embouchure. Journal of the Acoustical Society of America 13 (1942) 58–64. [Google Scholar]
- D.S. Reinhardt: Encyclopedia of the Pivot System. Charles Colin, New York, 1973. [Google Scholar]
- L. Little: Embouchure Builder: for Trumpet (Cornet). Classic Festival Solos. Alfred Music, 1996. ISBN 9781457490224. URL: https://books.google.at/books?id=HUInpVe0lhoC. [Google Scholar]
- P. Amann, V. Chatziioannou, P. Nicolay, R. Willmann: On the capabilities of a ‘digital mouthpiece’ for real-time recording of embouchure parameters for brass musicians, in: 10th Convention of the European Acoustics Association, 2023. [Google Scholar]
- P. Amann, P. Nicolay, V. Chatziioannou, R. Willmann: A “digital mouthpiece” for the autonomous analysis and improvement of brass musician performances, in: Fourth Vienna Talk on Music Acoustics, Proceedings of Meetings on Acoustics. ASA, 2023, p. 035022. [Google Scholar]
- P. Amann, V. Chatziioannou, P. Nicolay, R. Willmann: Embouchure parameter variations across brass musicians of different levels of proficiency, in: 11th Convention of the European Acoustics Association, 2025. [Google Scholar]
- M. Bertsch, A. Mayer: A new 3D transducer for measuring the trumpet mouthpiece force, in: Proceedings of the Forum Acusticum Budapest 29.08.–02.9, 2005, pp. 23–30. [Google Scholar]
- J.B. Davies, P. Kenny, J. Barbenel: A psychological investigation of the role of mouthpiece force in trumpet performance. Psychology of Music 17, 1 (1989) 48–62. [Google Scholar]
- JCGM (Joint Committee for Guides in Metrology): Evaluation of measurement data – Guide to the expression of uncertainty in measurement. International Organization for Standardization (ISO) and International Electrotechnical Commission (IEC), 2008. Available at: https://www.bipm.org/en/publications/guides. [Google Scholar]
- World Medical Association: World medical association declaration of Helsinki: ethical principles for medical research involving human subjects. JAMA 310, 20 (2013), 2191–2194. ISSN 1538-3598. [CrossRef] [PubMed] [Google Scholar]
- T. Prätzlich, J. Driedger, M. Müller: Memory-restricted multiscale dynamic time warping, in: 2016 IEEE International Conference on Acoustics, Speech and Signal Processing (ICASSP), 2016, pp. 569–573. [Google Scholar]
- M. Müller, F. Zalkow: libfmp: a Python package for fundamentals of music processing. Journal of Open Source Software (JOSS) 6, 63 (2021) 3326:1–5. [Google Scholar]
- B. Frederiksen: Arnold Jacobs: Song and Wind. Windsong Press Limited, Gurnee, Illinois, 1996. [Google Scholar]
- J. Stamp: Warm-Ups and Studies: Trumpet and Other Brass Instruments, Editions Bim, Ch-1674, Viarmares, Switzerland, 1998. [Google Scholar]
Appendix A
Derivation of upper- and lower-lip forces
Under quasi-static conditions, the upper- and lower-lip contact forces, FUL(t) and FLL(t), are derived from the static equilibrium of the movable mouthpiece rim illustrated in Figure A.1. The four load cells are arranged in two symmetric pairs associated with the upper and lower rim regions, respectively.
Let Fi(t) denote the axial force measured by load cell i. For compactness, we define the summed outputs of the two sensor pairs as
 (A.1)
(A.1)
In the side-view representation (right panel of Fig. A.1), the resultant forces of the upper and lower load-cell pairs act at effective vertical lever arms l1, 2 and l3, 4 with respect to the mouthpiece centre O. The lip contact forces are assumed to act at the upper and lower edges of the rim, separated by the rim diameter Dm.
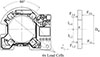 |
Figure A.1. Left: Top view of the mouthpiece electronics showing the angular arrangement of the four load cells, with an 80° separation between the two sensors assigned to each lip. Right: Schematic of the axial force balance used for the equilibrium-based derivation of the upper- and lower-lip contact forces (F UL, F LL), indicating the summed load-cell reactions (F 1, 2, F 3, 4), their effective lever arms (l 1, 2, l 3, 4), the mouthpiece centre (O), and the rim diameter (D m). |
Force equilibrium in axial direction yields
 (A.2)
(A.2)
Taking moments about the centre point O gives
![Mathematical equation: $$ \begin{aligned} \begin{aligned} \sum M_O = 0&\Rightarrow \frac{D_{\mathrm{m} }}{2} \left[ F_{\mathrm{UL} }(t) - F_{\mathrm{LL} }(t) \right] \\&= l_{3,4}\,F_{3,4}(t) - l_{1,2}\,F_{1,2}(t). \end{aligned} \end{aligned} $$](/articles/aacus/full_html/2026/01/aacus250188/aacus250188-eq28.gif) (A.3)
(A.3)
Solving equations (A.2) and (A.3) yields
![Mathematical equation: $$ \begin{aligned} F_{\mathrm{UL} }(t)&= \frac{1}{2} \left[ F_{1,2}(t) + F_{3,4}(t) \right]\nonumber \\&\quad + \frac{1}{D_{\mathrm{m} }} \left[ l_{3,4}\,F_{3,4}(t) - l_{1,2}\,F_{1,2}(t) \right], \end{aligned} $$](/articles/aacus/full_html/2026/01/aacus250188/aacus250188-eq29.gif) (A.4)
(A.4)
![Mathematical equation: $$ \begin{aligned} F_{\mathrm{LL} }(t)&= \frac{1}{2} \left[ F_{1,2}(t) + F_{3,4}(t) \right]\nonumber \\&\quad - \frac{1}{D_{\mathrm{m} }} \left[ l_{3,4}\,F_{3,4}(t) - l_{1,2}\,F_{1,2}(t) \right]. \end{aligned} $$](/articles/aacus/full_html/2026/01/aacus250188/aacus250188-eq30.gif) (A.5)
(A.5)
For the symmetric sensor arrangement employed here, the effective lever arms of the two load-cell pairs are equal, such that
 (A.6)
(A.6)
Under this condition, Equations (A.4) and (A.5) simplify to
![Mathematical equation: $$ \begin{aligned} F_{\mathrm{UL} }(t)&= \frac{1}{2} \left[ F_{1,2}(t) + F_{3,4}(t) \right]\nonumber \\&\quad + \frac{l}{D_{\mathrm{m} }} \left[ F_{3,4}(t) - F_{1,2}(t) \right], \end{aligned} $$](/articles/aacus/full_html/2026/01/aacus250188/aacus250188-eq32.gif) (A.7)
(A.7)
![Mathematical equation: $$ \begin{aligned} F_{\mathrm{LL} }(t)&= \frac{1}{2} \left[ F_{1,2}(t) + F_{3,4}(t) \right]\nonumber \\&\quad - \frac{l}{D_{\mathrm{m} }} \left[ F_{3,4}(t) - F_{1,2}(t) \right]. \end{aligned} $$](/articles/aacus/full_html/2026/01/aacus250188/aacus250188-eq33.gif) (A.8)
(A.8)
Finally, because the exact line of action of the lip contact forces at the mouthpiece rim cannot be uniquely defined and varies across players and playing conditions, the effective lever arm is approximated as l ≈ D m/2. Under this approximation, the expressions reduce to
 (A.9)
(A.9)
The approximation in equation (A.9) is expected to hold as long as dynamic inertial effects and rim tilting remain small compared to axial loading.
Appendix B
Supplementary figures
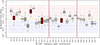 |
Figure B.1. Boxplots of the normalised force ratio for notes from the easier section, ordered by proficiency level (left: beginners; right: professionals). Box shading encodes variability as the interquartile range (IQR), with darker shading indicating greater variability across notes. The four dark-red boxes highlight the participants with the highest interquartile ranges. The two dark-red vertical lines mark the boundaries between the theoretical proficiency groups (beginners, advanced, and professional musicians). |
Cite this article as: Amann P. Kloss-Brandstatter A. Willmann R. Chatziioannou V. & Nicolay P. 2026. Experimental investigation of lip-specific mouthpiece forces and pressure parameters in trombone performance under realistic playing conditions. Acta Acustica, 10, 28. https://doi.org/10.1051/aacus/2026025.
All Figures
|
Figure 1. Mechanical structure of the sensor-integrated measurement device. |
| In the text | |
|
Figure 2. Front view and cross-sectional view of the measurement device, showing the mechanically fixed and movable parts, the sealing gap, and the locations of the pressure sensors used for oral and mouthpiece pressure measurements. |
| In the text | |
|
Figure 3. Top view of the electronic assembly, illustrating the arrangement of the load cells assigned to the upper and lower lips. |
| In the text | |
|
Figure 4. Top: Initial validation setup using a precision scale, with calibrated weights applied to the mouthpiece rim in different distribution patterns to compare the reference scale readings with the mouthpiece force sensor output. Bottom: Force measurement characterisation performed using a Zwick/Roell ZwickiLine Z020 universal testing machine under controlled and reproducible loading conditions. |
| In the text | |
|
Figure 5. Comparison of force signals recorded during the Zwick/Roell testing machine validation test for the measuring device, including a time-resolved error measure. Top: Reference force measured by the Zwick/Roell ZwickiLine compression testing machine (red) and reconstructed forces from the mouthpiece measuring system (MS) for total force (black), upper-lip force (yellow), and lower-lip force (green). Grey shaded regions indicate quasi-static force plateaus detected from the reference signal. Bottom: Sliding-window relative root-mean-square error (rRMSE) between the total force recorded by the mouthpiece and the reference force, computed over a 0.2 s window, where the RMSE in each window is divided by the mean absolute reference force within the same window. |
| In the text | |
|
Figure 6. Excerpt from Part 1 (easy) and Part 3 (difficult) of the provided musical score, featuring well-known technical and melodic passages. Red highlighted segments indicate different articulation styles (legato, accented, staccato). |
| In the text | |
|
Figure 7. Distribution of proficiency levels among all participants, categorised by results of the questionnaire. |
| In the text | |
|
Figure 8. Plot of the aligned data recorded by the measuring device during an ascending note sequence performed by participant 31. The data includes oral pressure (red), mouthpiece pressure (blue), lower lip force (green), upper lip force (yellow), and MIDI pitch (black). |
| In the text | |
|
Figure 9. Comparison of mouthpiece forces across all participants, ordered by level of proficiency (left: beginners; right: professional musicians). (A) Absolute mean mouthpiece force of the upper (lighter colour) and lower (darker colour) lips. (B) Corresponding normalised mean mouthpiece force, computed separately for each lip as |
| In the text | |
|
Figure 10. Mouthpiece force and pressure during an F4 note performed with a dynamic crescendo from piano to forte and a decrescendo back to piano. The data shown correspond to Participant 31 (P31). The plot includes the mouthpiece pressure (blue), the RMS of the mouthpiece pressure (dark blue), the force exerted by the lower lip (green), and the force exerted by the upper lip (yellow). |
| In the text | |
|
Figure 11. Box plots of the normalised force ratio between upper and lower lips. The top panel shows data across all notes for all participants; the bottom panel focuses on participants P22 to P31 across different pitch registers (loRan – low register: ≤B♭2; lomiRan – lower middle register: ≤B♭3 and >B♭2; himiRan – upper middle register: ≤F4 and >B♭3; and hiRan – high register: >F4). Positive values indicate greater upper-lip force, negative values indicate greater lower-lip force. Background colours denote force distribution types: red for upper-lip dominance, blue for lower-lip dominance, and yellow for balanced distribution. |
| In the text | |
|
Figure 12. Comparison plot illustrating intra-individual repeatability for a single musician performing the same note sequence twice (top: repetition 1, bottom: repetition 2). The signals shown are mouthpiece pressure (blue), upper-lip force (yellow), and lower-lip force (green). |
| In the text | |
|
Figure 13. Comparison plot of a beginner (top) and a professional musician (bottom) performing the same notes. The data display mouthpiece pressure (blue), lower-lip force (green), and upper-lip force (yellow). |
| In the text | |
|
Figure A.1. Left: Top view of the mouthpiece electronics showing the angular arrangement of the four load cells, with an 80° separation between the two sensors assigned to each lip. Right: Schematic of the axial force balance used for the equilibrium-based derivation of the upper- and lower-lip contact forces (F UL, F LL), indicating the summed load-cell reactions (F 1, 2, F 3, 4), their effective lever arms (l 1, 2, l 3, 4), the mouthpiece centre (O), and the rim diameter (D m). |
| In the text | |
|
Figure B.1. Boxplots of the normalised force ratio for notes from the easier section, ordered by proficiency level (left: beginners; right: professionals). Box shading encodes variability as the interquartile range (IQR), with darker shading indicating greater variability across notes. The four dark-red boxes highlight the participants with the highest interquartile ranges. The two dark-red vertical lines mark the boundaries between the theoretical proficiency groups (beginners, advanced, and professional musicians). |
| In the text | |
Current usage metrics show cumulative count of Article Views (full-text article views including HTML views, PDF and ePub downloads, according to the available data) and Abstracts Views on Vision4Press platform.
Data correspond to usage on the plateform after 2015. The current usage metrics is available 48-96 hours after online publication and is updated daily on week days.
Initial download of the metrics may take a while.