Figure 7
Download original image
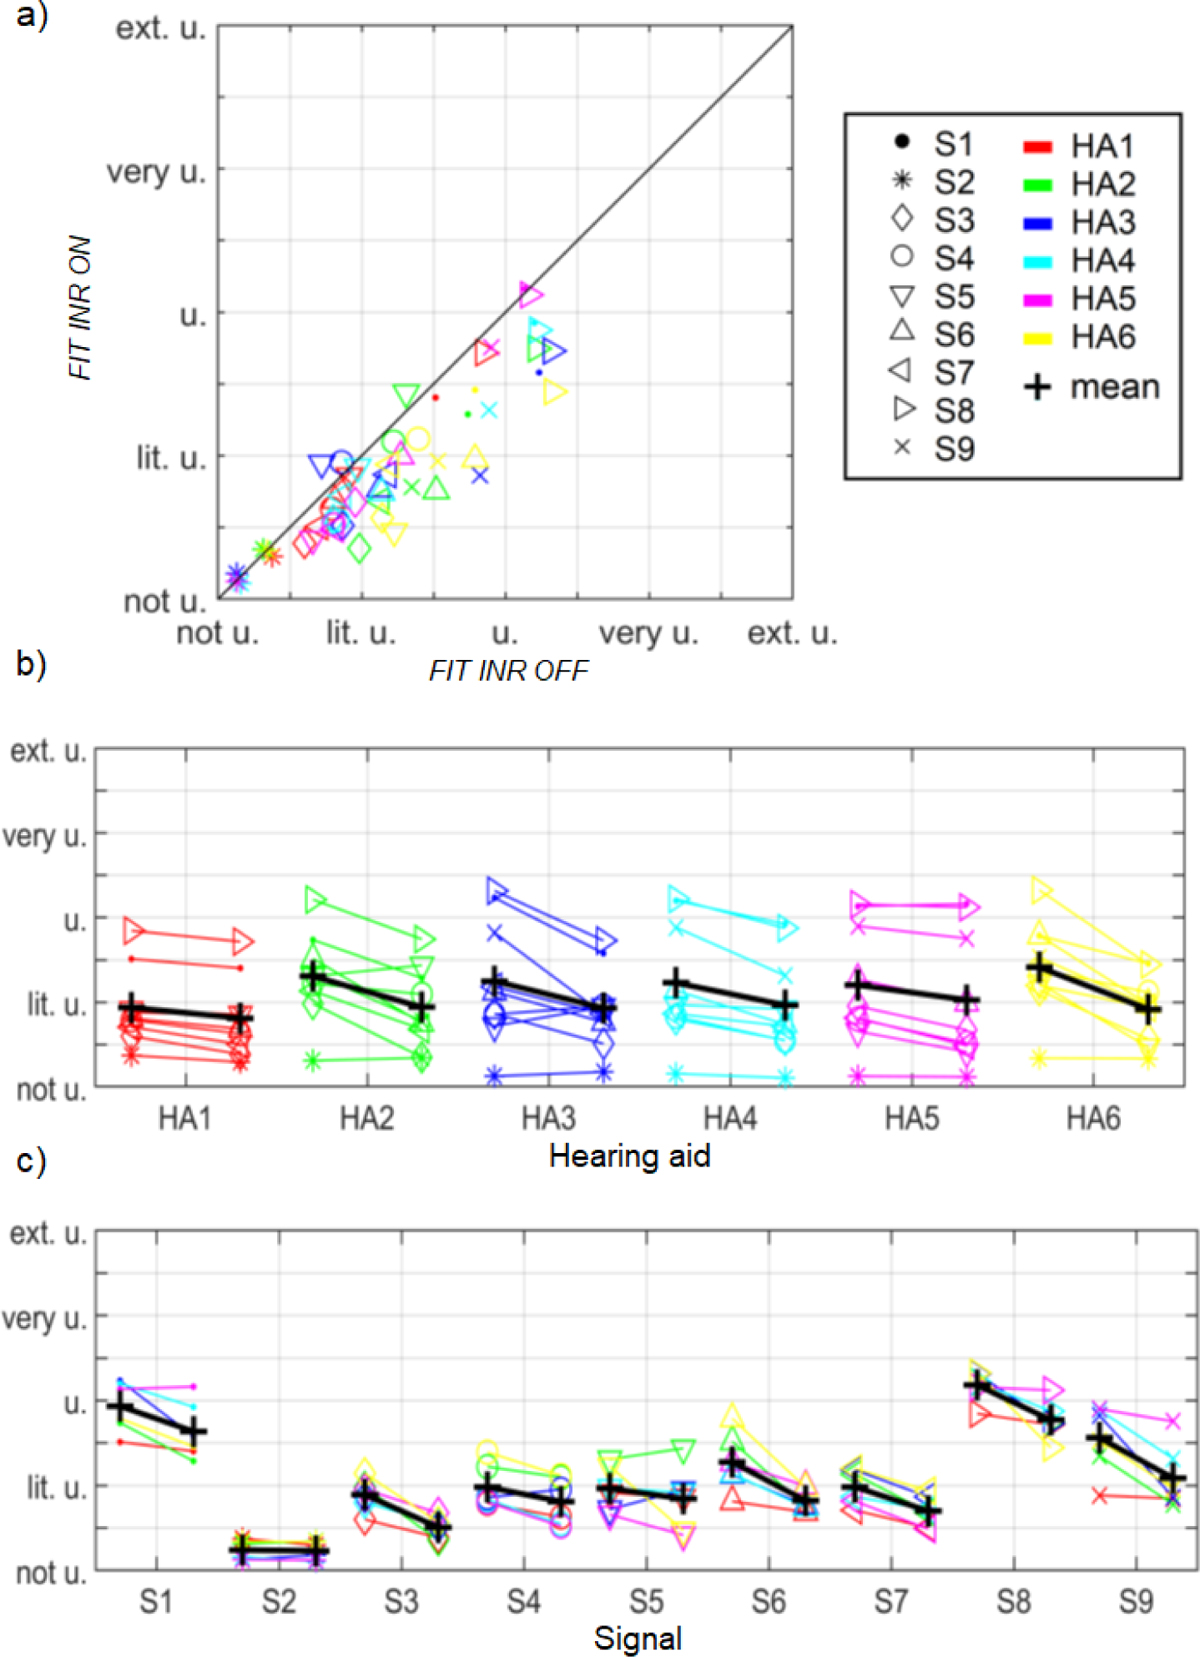
Ratings of discomfort averaged across hearing-impaired subjects with hearing aids for the settings FIT INR OFF and FIT INR ON visualized as a scatter plot (a) or grouped after the type of hearing aid (b) or the type of stimulus (c). In (b) and (c), the left values correspond to the setting FIT INR OFF and the right values to the setting FIT INR ON.
Current usage metrics show cumulative count of Article Views (full-text article views including HTML views, PDF and ePub downloads, according to the available data) and Abstracts Views on Vision4Press platform.
Data correspond to usage on the plateform after 2015. The current usage metrics is available 48-96 hours after online publication and is updated daily on week days.
Initial download of the metrics may take a while.