Figure 3
Download original image
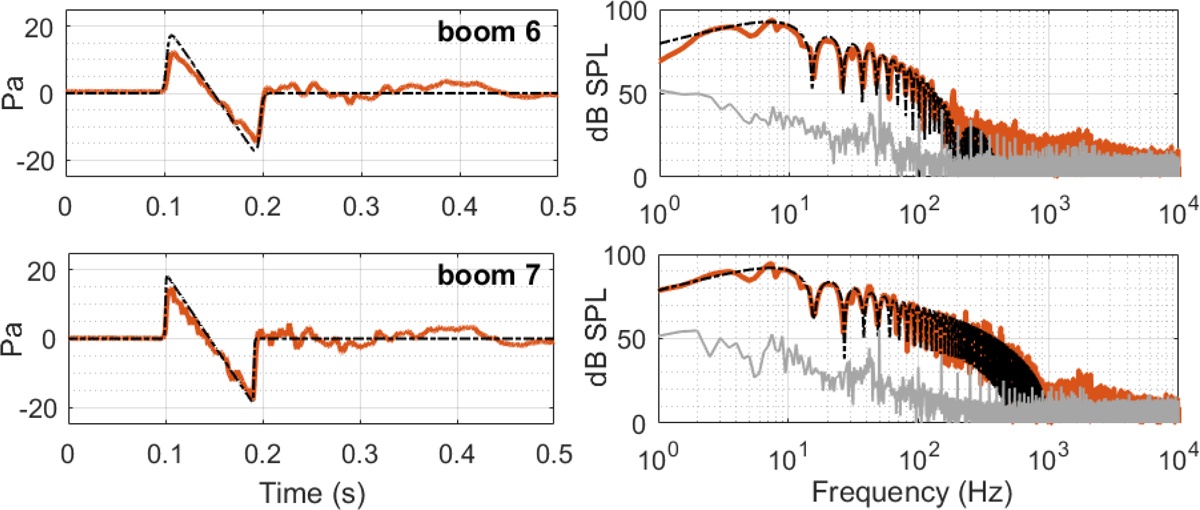
Comparison between the target signals (N-wave like booms, in dotted black) and the measured signals (in solid red) at the door F3 between bedroom 3 and the living room, generated by simulator 3. Top: low boom signal 6. Bottom: high boom signal 7. Left: temporal waveforms. Right: frequency spectra. Measured spectra are noisier and decay much slower in the high frequency limit. Lower curves in light grey show ambient noise spectra measured during 2 s.
Current usage metrics show cumulative count of Article Views (full-text article views including HTML views, PDF and ePub downloads, according to the available data) and Abstracts Views on Vision4Press platform.
Data correspond to usage on the plateform after 2015. The current usage metrics is available 48-96 hours after online publication and is updated daily on week days.
Initial download of the metrics may take a while.