| Issue |
Acta Acust.
Volume 9, 2025
|
|
|---|---|---|
| Article Number | 8 | |
| Number of page(s) | 26 | |
| Section | Environmental Noise | |
| DOI | https://doi.org/10.1051/aacus/2024083 | |
| Published online | 21 January 2025 | |
Scientific Article
Impact of reduced sonic boom exposure on introspective judgments and annoyance, pleasantness and loudness ratings for simulated booms presented in a realistic indoor environment
Sorbonne Université, CNRS, Institut Jean le Rond d’Alembert, 75005 Paris, France
* Corresponding author: This email address is being protected from spambots. You need JavaScript enabled to view it.
Received:
8
November
2023
Accepted:
15
November
2024
Abstract
This paper reports on a project that quantified the effects of sonic boom exposure on human responses, in situations representative of the daily life of European citizens, to inform policy, and develop protection concepts for a new generation of supersonic commercial aircraft that should emit a reduced but perceivable boom while flying overland. Two reduced boom simulators were affixed to the bedroom windows of a house located on our university campus. The simulators were used to study indoor the participants’ responses to simulated “outdoor” booms. Testing took place in both the living room and kitchen because the booms caused different intensities of rattle noise in those two rooms. Participants performed cognitive and psychophysical tasks (Marmel et al. Acta Acust. 8 (2024) 1. https://doi.org/10.1051/aacus/2023063) and had mandatory rests. Questionnaires were used to assess the participants’ introspective judgment of the boom interference with the activities and how it could be linked to their noise sensitivity. In addition, the participants’ perception of the booms was studied via ratings of annoyance and pleasantness, and via loudness comparisons. The negative interference of the booms was greater during rest than during tasks and for booms with higher than lower levels. This was not directly reflected in the objective performance degradation reported in the reference cited above and thus contributes to a more complete picture of the influence of the sonic booms on humans. Moreover, booms were found to be annoying and unpleasant, even more so at a higher level and with the presence of rattle noise.
Frederic Marmel is now at WS Audiology, ORCA Europe, Stockholm, Sweden
© The Author(s), Published by EDP Sciences, 2025
 This is an Open Access article distributed under the terms of the Creative Commons Attribution License (https://creativecommons.org/licenses/by/4.0), which permits unrestricted use, distribution, and reproduction in any medium, provided the original work is properly cited.
1 Introduction
Considering the context (detailed in Cretagne et al. [1]) of the current research and development of a new generation of supersonic commercial aircraft that should emit a reduced but perceivable boom (a “low boom”) while flying overland, this study aimed to quantify the effects of this reduced sonic boom exposure on human responses, in representative situations of the daily indoor life of European citizens, so as to inform policy, establish standards and develop protection concepts. Importantly, we aimed to investigate human responses in such an ecologically valid as possible context, as much in terms of the environment (a real house) as in terms of activities, for which we chose a variety of controlled tasks inspired by daily life indoor activities as well as rest periods. Designing this study in such an ecologically valid context proved to be challenging, in particular as there was little research in the literature that could inform our choices. To our knowledge, laboratory studies on human response to sonic booms have all focused on sensation and subjective responses such as ratings of loudness and annoyance [2], even the recent studies focusing on reduced booms [3–5], and did not have participants engage in a cognitive or psychophysical task while they were being exposed to the booms. On the other hand, the National Aeronautics and Space Administration (NASA) has been developing community studies [6, 7], in which people are exposed to reduced booms through the special dive manoeuvre of a fighter jet while they carry on with their daily life activities. However, these activities are not controlled and thus these community studies cannot relate boom parameters to performance in specific cognitive and psychophysical tasks.
Our study aimed to relate the boom level and the degree of rattle noise elicited by the booms to, on the one hand, performance degradation in cognitive and psychophysical tasks and, on the other hand, to participants’ introspective judgments of boom interference during the tasks. To this end, performance degradation as well as boom disturbance were tested in a working-memory task, because the detrimental effect of noise on working memory is well documented, in a motor control task, to test whether the booms would make participants startle, and in a conversational task, to test whether the booms would disrupt the conveying of information. Performance results have been reported in a previous publication [8]: performance degradation was observed in the form of delayed responses in the working memory task, in a momentary slowing down in the drawing task, and in a trend for a worsening of communication efficiency in the conversational task.
The present manuscript reports the results of the introspective judgments of boom interference, which were tested via a series of short questionnaires at the end of the tasks. We also evaluated the boom interference during rest periods, using the same questionnaires. Three 15-min rest periods were scheduled, during which participants were asked to take a short nap as booms were being presented in the background. These rest periods were included because boom annoyance has been shown to be greater when people are trying to rest [9, 10]. We believe that introspective judgments of the interference of the booms with the activities (tasks and rest) are important to complement the quantitative study on performance degradation in the tasks [8] as both need to be taken into account while evaluating the influence of noise on humans. Even if performance is not degraded, a negative perception might potentially lead to some negative effects in the long run, for example via physiological stress or learned helplessness [11, 12], and thus requires to be studied. To further evaluate the booms’ interference with the rests, we attempted to evaluate the effect of the booms on the rests’ effectiveness by asking participants to rate their mood on mood scales before and after each rest. The interference of the booms during the activities (tasks and rests), as perceived subjectively by the participants and reported via introspective judgments, constitutes the first research question of this article and is addressed in Section 3.
The second research question of this article was whether the interference of the booms during the activities would relate to the participants’ noise sensitivity (evaluated with the NoisSeQ-R questionnaire: [13, 14]) or to their general attitude towards noise. This second research question is addressed in Section 4.
Finally, as a third research question, this article investigates the effect of being in a natural environment (a real house) on listeners’ subjective evaluations of certain direct perceptual attributes of the booms, particularly annoyance and loudness, as a function of the boom level and of the presence (or not) of rattle noise. Rattle noise has indeed been shown to increase annoyance [15, 16]. Also, this research question follows the recommendations of Töpken and van de Par in their conclusion [5] to obtain ratings “that are closer to a prospective real life assessment and more ecologically valid”. This last research question is addressed in Section 5.
2 General design
The study’s design was described in detail in Marmel et al. [8) so only a brief summary is provided here. The study took place on the ground floor of a house on a remote section of our university (Sorbonne Université – Campus Saint-Cyr-l’École). Both the living room and the kitchen were used for the study because these two rooms provided different degrees of rattle noise. The kitchen provided the strongest rattle, and the living room provided either a lighter rattle or almost no rattle at all depending on whether a door was open or not. This created three rattle conditions, referred to in the remainder of this paper as Kitchen, Living Room, and No Rattle respectively.
Two participants were scheduled for each experimental session so that they could be tested together in a communication task. One participant did not show up, resulting in a final sample of 41 participants (aged 18‒69 years). The two participants in a pair were each assigned specific testing positions in the kitchen and in the living room, as well as specific napping positions in the living room.
The study used two boom simulators affixed to the bedroom windows to present the reduced booms (see [1], for full details on the simulators). Two boom signals of different levels were synthesised to create a Low Boom and a High Boom condition. Some of the testing was also carried in a No Boom condition, without any booms presented. As the living room was between the bedrooms and the kitchen, the two boom levels were higher in the living room than in the kitchen. The boom levels were also slightly different between the two testing positions in each room. When averaged over the two testing positions in each room, the boom levels for the Low Boom were: 62.6 dB ASEL for the Living Room condition, 62.7 dB ASEL for the Kitchen condition, and 60.8 dB ASEL for the No Rattle condition. The boom levels for the High Boom were: 68.6 dB ASEL for the Living Room condition, 64.7 dB ASEL for the “Kitchen” condition, and 68.2 dB ASEL for the No Rattle condition. The various levels result from a competition between two effects: the decrease of low frequency (LF) content in the kitchen because of more indirect exposure, but an increase of high frequency (HF) content due to rattle noise. The High Boom having at the source a higher HF content, the effect of rattle is not dominant and the level differences are mainly due to the position (kitchen or living room). On the contrary, the Low Boom has a lower HF content so the effect of rattle is dominant and the level differences are mainly due to the presence of rattle or not.
The study consisted of one experimental session lasting between four and four and a half hours. Figure 1 illustrates the full course of the session (including the psychophysical tasks reported in [8].
 |
Figure 1 Flow chart of the experimental session, depicting all activities. The ellipses indicate the 4 activities (3 psychophysical tasks and rest periods), and the solid rectangles depict the questionnaires and ratings. |
3 Introspective judgments of the interference of the booms with the experimental activities
3.1 Questionnaires after the tasks and the rest periods
3.1.1 Questionnaires procedure
Every time the participants completed a rest period or a run of the working memory task, the motor control task, or the communication task, they were asked questions (Tab. 1, and Appendix 2 for the list of questions in their original French language) meant to help us understand the respective influences on the participants of the booms and their associated rattle noise, as a function of their levels (which varied depending on whether the participants were in the living room or in the kitchen), and as a function of the activity performed (rest period, working memory task, motor control task, communication task). We tried to quantify these influences with “indirect effect” and “direct effect” questions. The former aimed to gather data on how the booms and the rattle affected the difficulty of the tasks, and were thus not asked after the rest periods. The latter were designed to address the complexity of noise annoyance which is a “multifaceted concept” having in particular a behavioural aspect (disturbance during activities) and an evaluative aspect (unpleasantness) [17].
List of questions asked after each short run of the psychophysical tasks (all of them) and after each rest period (“direct effect” questions only), as well as the associated labels used in Figure 2. The questions were always asked in the following order: “indirect effect” questions (1–2), “direct effect” questions about the booms (1–6), and “direct effect” questions about the rattle noise (1–6).
For the No Boom condition in the living room, participants were instructed to answer 0 to all the “direct effect” questions (purely for practical purposes: the questions were not applicable but our data collection program still needed some user input to move on. The “direct effect” questions in the No Boom condition were not included in the data analyses). All the questions were to be answered using a 11-point numerical scale [0:10] with 3 verbal labels: Not at all (0), Moderately (5) and Extremely (10).
3.1.2 Questionnaires data analysis
The questions were analysed in four separate analyses. These analyses aimed to answer two questions: whether the respective effects on the participants of the boom and its associated rattle were different i) depending on the room (living room versus kitchen, leading to different levels) and ii) depending on the activity in which the participants were involved (rest period or one of the three tasks: working memory, motor control, and communication). The four analyses were performed with ART ANOVAs [18] because the ratings were not normally distributed for all the questions. The “how easily could you ignore...” questions were dropped from the analyses because the response scale was reversed compared to the other questions (answering 10 for this question meant that the booms/rattle were extremely easy to ignore, whereas a 10 on the disturbance question meant the booms/rattle were extremely disturbing) and we had doubts on whether this had been clear to all participants. The dependent and independent variables as well as the number of participants that were used for each analysis are provided in Table 2.
Information about the four statistical analyses: research questions, dependent and independent variables, and number of participants.
Forty-one participants completed the study but one failed to use the instructed response keys in the working memory task and was excluded from all analyses (reducing the number to 40 participants), hence the first two analyses were performed on 40 participants. The third analysis included 39 participants because, in addition to the participant excluded from the working memory task, one participant did not have a partner to do the communication task. The fourth analysis included 32 participants because of the participant excluded for the working memory task and because we only added questionnaires for the rest periods after the first 4 pairs of participants had been tested.
3.1.3 Questionnaires results
Figure 2 shows the results of the questionnaires described in Table 1 for the working memory task, the motor control task, the communication task, and for the rest periods.
 |
Figure 2 Questionnaires completed after each run of the tasks and after the rests. Answers were averaged across participants. The full range for all response scales is from 0 to 10. Error bars represent 95% confidence intervals. “Direct effect” questions are in Figure 2A and “indirect effect” questions are in Figure 2B. |
We report here the statistical effects for the four analyses described in Table 2. The first analysis showed a two-way interaction between the “indirect effect” questions and the tasks (see Tab. A1 in Appendix 1 for all statistical details of these four analyses), which points to the pattern (Fig. 2B: working memory task and motor control task) that the working memory task required more concentration, but less effort, than the motor control task. Furthermore, a significant three-way interaction between the room conditions, the boom levels and the tasks was obtained, pointing to different patterns in the living room and in the kitchen. In the living room, the effect of the booms on task concentration and effort were as expected, with greater concentration and effort (when combining the two tasks and the two questions) when the booms were High Booms than Low Booms, and the No Boom condition being associated with the weakest concentration and effort. However, in the kitchen, the differences between High Booms and Low Booms were inconsistent between tasks, with greater concentration and effort when the booms were High Booms than Low Booms in the motor control task, but the reverse pattern being observed in the working memory task.
The second analysis showed a main effect of the “direct effect” questions (see Tab. A1 in Appendix 1 for all statistical details) with the ratings being higher for the boom disturbance, boom unpleasantness, boom intensity and rattle awareness than for the boom surprise, rattle disturbance, rattle unpleasantness, rattle intensity, and rattle surprise (Fig. 2A: working memory task and motor control task). In addition, the ratings for the rattle surprise were lower than all the others. A second main effect was obtained for the room condition with the ratings being higher overall in the living room than in the kitchen. Finally, a significant two-way interaction between the room condition and the boom levels points to the ratings being higher in the living room for the High Booms than for the Low Booms, whereas ratings in the kitchen did not differ between the boom conditions. Regarding our first question, i.e. whether the respective effects on the participants of the boom and its associated rattle were different depending on the room, the two analyses showed that the higher boom level made the working memory and motor control tasks more challenging (“indirect effect”) in the living room, and the higher booms in themselves were judged more severely than the lower booms (“direct effect”) in the living room. However, these differences between the two boom conditions were not observed in the kitchen. Finally, the rattle was noticed but was not judged as severely as the associated booms.
The third analysis showed main effects of the “indirect effect” questions and of the activities (Fig. 2B: the three tasks). The task concentration ratings were higher overall than the task effort ratings, and the ratings (both concentration and effort) were lower for the communication task than for the other two tasks.
The fourth analysis showed main effects of the “direct effect” questions pointing to the same differences between the “direct effect” questions as observed in the second analysis (Fig. 2A: the four activities, for the living room only). A main effect of the boom levels points to higher ratings being observed for the High Booms than for the Low Booms in the living room, as in the second analysis. Finally, a main effect for the activities points to the ratings being the highest in the rest periods, intermediate in the working memory and motor control tasks, and the lowest in the communication task (Fig. 2). Regarding our second question, i.e. whether the respective effects on the participants of the boom and its associated rattle were different depending on the activity, the two analyses showed that the booms did not affect the communication task as much as the working memory and the motor control task. Similarly, the booms were not judged as severely in themselves in the communication task as in the working memory and motor control tasks. Finally, the booms were judged more severely in the rest periods than in the three tasks.
3.1.4 Questionnaires discussion
There are four takeaways from these results. First, ratings for the “direct effect” questions were significantly higher for the rest periods than for the three tasks. Taken together, the “direct effect” questions can be interpreted as reflecting the “global disturbance” of the booms and their associated rattle. Our observation that global disturbance was greater when participants were resting than when they were active confirms previous research findings that sonic booms are particularly disturbing when people are trying to rest/relax [9, 10]. Second, global disturbance was weaker in the communication tasks than in the working memory task and in the motor control task. This may be because the communication task was the easiest task: the “indirect effect” questions indicated that the booms complicated the working memory and motor control more than they did the communication task. Nevertheless, given the importance of communication situations in everyday life, future studies should seek to further compare communication to other tasks while ensuring that all tasks have the same difficulty.
Third, global disturbance was greater for booms presented at a higher level, which was the case of the High Booms in the living room only. As indicated in Marmel et al. [8] (Tab. 1) and reported in Figure 7, High Booms and Low Booms had different levels in the living room (6–7 dB re. A-weighted level), but in the kitchen their level difference was actually very small (only 2–3 dB re. A-weighted level). The influence of the boom condition on global disturbance reflected the different boom level differences achieved in the two rooms. The negative influence of increasing boom levels was also observed on the “indirect effect” questions: the booms complicated the working memory and motor control tasks (in terms of effort and concentration) in a way consistent with the actual levels.
Fourth, because the kitchen provided stronger rattle than the living room, we expected higher responses to the “direct effect” questions addressing the rattle in the kitchen than in the living room. We did not observe that for any of the two tasks performed in both rooms (Fig. 2, working memory and motor control). Instead, the second analysis reported higher ratings for the “direct effect” questions in the living room than in the kitchen, which is consistent with the boom levels being higher in the living room than in the kitchen because of the indoor transmission from the bedrooms to the kitchen, with the living room between them. Also, both the second and fourth analyses reported higher ratings for the “direct effect” questions addressing the booms than for the “direct effect” questions addressing the rattle (with the exception of “boom surprise”). Taken together, these results suggest that participants gave more “perceptual weight” to the boom levels than to the rattle when evaluating the global disturbance of the booms, even when the questions specifically addressed the rattle. It might be that participants’ lack of familiarity with rattle made its evaluation harder and might have nudged participants into relying on the more familiar percept (the boom noise) when answering the questions, especially as they did not evaluate the booms and rattle immediately after each boom but only after completing a task run or a rest period and thus had to try to remember how the booms and rattle felt.
In addition, it is interesting to look at these results in the light of the performance degradation results presented in Marmel et al. [8], and to note that there are inconsistencies. High Booms were generally evaluated more negatively than Low Booms (higher ratings on Fig. 2), even though performance degradation was more robustly observed for the Low Booms. Performance degradation tended to be greater for the Low Booms in the working memory task ([8], Fig. 5), and a trend for a worsening of communication efficiency in the conversational task was only observed for the Low Booms ([8], Fig. 8). Performance degradation in the motor control task was not significantly modulated by the change in boom level ([8], Fig. 4). These inconsistencies suggest that subjective evaluations are not directly linked to objective performance degradation and must then be included to have a broader and more complete picture of the influence of the sonic booms on humans.
3.2 Mood scales before and after the rest periods
3.2.1 Mood scales procedure
We collected mood data at the beginning and at the end of each rest period to evaluate the interference of the booms with participants resting (see Fig. 1). We modified visual analogue mood scales [19, 20] in the following ways: the scales were numerical, from 0 on the left-end of the scale to 100 on the right-end of the scale, and the scales’ left-end and right-end were marked respectively by a mood-positive face and by a mood-negative face, with the middle value (50) corresponding to mood-neutrality. Four separate mood scales were used to assess the following mood state opposites: rested/tired, relaxed/stressed, energetic/lethargic, and happy/unhappy. For clarity, Figure 3 shows an English translation of the graphical interface with the four mood scales.
 |
Figure 3 The four mood scales, as displayed on the graphical interface, but with all the text translated to English. |
3.2.2 Mood scales data analysis
We calculated the shifts in mood during rest periods by subtracting, for each rest period and each mood rating scale, the rating collected at the end of the period from the rating collected at the beginning of the period. Thus, positive mood shift values indicate a shift toward a more positive mood. As mood shifts were not normally distributed, we analysed them using the aligned-ranked statistical technique for nonparametric factorial ANOVAs proposed by Wobbrock et al. [18] (using the ARTool package in R). We performed a two-way ART ANOVA with the applicable boom conditions (No Boom, Low Boom, and High Boom) and the four mood shifts as independent variables. One participant was dropped from the analysis because he reported very large shifts in mood during the No Boom rest period, towards negative moods.
3.2.3 Mood scales results
The mood shifts are presented in Figure 4. The results show that fatigue and stress were the most sensitive scales to the booms, which is confirmed by the statistical analysis, revealing a main effect of the scale [F(3, 429) = 23.3; p < 0.001; partial eta-squared (ηp2) = 0.14]. They suggest as well that stress may be sensitive to the boom condition, but this falls below statistical significance (no main effect of the boom condition: F(2, 429) = 1.75; p = 0.17, and no interaction effect between the scale and the boom conditions: F(6, 429) = 0.87; p = 0.51).
 |
Figure 4 Mood shifts during the rest periods, averaged across participants. Greater positive valued mood shifts indicate shifts toward more positive moods. As the mood scales ranged from 0 to 100, the mood shifts’ full range is from −100 to 100. Error bars represent 95% confidence intervals. |
3.2.4 Mood scales discussion
The main takeaway from the mood scales ratings is that the fatigue and stress scales seem to have the potential to reflect a detrimental influence of the booms on participants’ ability to “recuperate” during a rest. Figure 4 suggests that booms, and especially High Booms, might hinder recuperation and relaxation during a rest. This hypothesis is also substantiated by past St. Louis [21] and Oklahoma [22] community studies pointing out interference between (very high) booms and rest for 15–20% of the responses. Even though the differences were not significant in our statistical analysis, future studies using larger samples (and thus attaining greater statistical power) may want to focus on “fatigue” and “stress” scales to investigate the effect of reduced sonic booms on the quality of rests. These future studies might also benefit from including rattle as a factor. Future community surveys should include boom exposure in periods favourable for rest time, such as evenings, weekends, holidays, or naps after meals depending on local habits.
Finally, the trend for stress and fatigue to decrease less after the rest period for the High Boom than for the Low Boom is in agreement with the more negative evaluation of the High Boom observed in the Questionnaires results (Sect. 3.1.3, bottom of Fig. 2). This strengthens the observed trend and may suggest that there is an effect that does not reach statistical significance because of our limited sample size.
4 General attitude to noise and its influence on the interference of the booms
4.1 End-of-session questionnaire procedure
Participants completed an end-of-session questionnaire. They had to fill out: demographic information (date of birth, level of education), the NoiSeQ-R reduced noise sensitivity questionnaire [13, 14], and questions regarding their attitude towards noise, and especially traffic noise as well as satisfaction with the noise in their living environment. The full questionnaire in French is given in Appendix 3 and its content is summarised in English in Table 3.
Summary description of the end-of-session questionnaire.
4.2 End-of-session questionnaire data analysis
The effect of the booms on task performance (for the tasks where we observed such an effect), and the global disturbance of the booms during the rest periods may correlate with sections of the end-of-session questionnaire that either directly address noise sensitivity or that may indirectly and partly reflect noise sensitivity. We may expect the following correlations:
positive for noise sensitivity (NoiSeQ-R), meaning that the effect of the booms is higher for participants who are more noise sensitive,
negative for general attitude (general evaluation) towards traffic noise insofar as a more negative attitude to traffic noise might come from heightened sensitivity to noise,
negative for satisfaction regarding noise in neighbourhood insofar as weaker satisfaction might reflect heightened sensitivity to noise,
positive for annoyance regarding traffic noise and neighbourhood noise at home, insofar as such annoyance might reflect heightened sensitivity to noise,
positive for indoor home activities.
In addition, the effect of the booms on task performance (for the tasks where we observed such an effect) and the global disturbance of the booms during the rest periods may correlate with sections of the end-of-session questionnaire that either directly address the sensation of control over noise and the degree of adaptation to noise, or that may indirectly and partly reflect the sensation of control and/or the degree of adaptation. We may expect the following correlations:
negative for the sensation of control and capacity of adaptation regarding noise at home,
positive for worries about potential negative effects of traffic noise, insofar as such worries may reflect the sensation of a lack of control over noise,
negative for the trust in authorities regarding traffic noise management, insofar as a weaker trust may reflect the sensation of a lack of control over noise,
positive for the intensity of noise perceived at home at day and night, insofar as reporting more intense noise at home might reflect a weaker degree of adaptation to noise.
The nine sections of the end-of-session questionnaire listed in the possible correlations a) to i) are provided in Table 4 and labelled with the same letters for clarity. As they each comprised several questions we used an average rating for each section, obtained by averaging ratings across all the questions of a section, in order to minimise the number of correlations to compute. The only exception to this rule was for section e) (Tab. 4: Home activities disturbed by traffic noise). We discarded the three questions about outdoor activities, and, for the indoor activities, we separated sleep/rest from other activities. The rationale to test our hypotheses regarding correlations a)–i) is to correlate these averaged ratings (called hereafter “questionnaire variable”) on one hand with variables defined to quantify the boom interference with the activities on the other hand (hereafter called “interference variables”). To this end, three activities were considered: the two tasks for which we observed a significant effect of the booms on individual participants (see [8]) and the rest periods. Three “interference variables” were thus defined, to reflect the performance degradation for the two tasks and the perceived global disturbance for the rest periods. For the working memory task, the “interference variable” quantified the significantly delayed responses observed in the Low Boom conditions (averaging the z-scores over the two Low Boon conditions, see [8]). For the motor control task, it reflected the momentary slowing down observed in all four boom conditions (averaging the z-scored differences between the time spent on the drawing area during which a boom occurred and the areas which were worked on before and after, averaged over the four boom conditions). For the rest periods, it was determined by averaging the ratings for the boom-related questions in the questionnaire completed after the rests, averaged over the four boom conditions. For the eight questionnaire sections a)–d) and f)–i), the “questionnaire variable” was correlated with the three “interference variables”. This led to 8 × 3 = 24 correlations. In addition, the “questionnaire variable” calculated with the ratings of subsection e) 1.’s questions (indoor activities) was correlated to the two “interference variables” obtained for the two tasks while the “questionnaire variable” calculated with the ratings of subsection e) 2.’s questions (rest and sleep) was only correlated to the “interference variable” for the rest periods. We thus computed a total of 27 correlation coefficients. As data were not normally distributed, the correlation coefficients were computed using Kendall’s Rank Correlation Coefficient (Kendall’s τ). The significance level for the p values was 0.0019, following the Dunn-Sinak correction for multiple comparisons.
Correlations between the selected extracts from the end-of-session questionnaire and the selected experimental measurements.
4.3 end-of-session questionnaire results
None of the correlations computed reached the Dunn-Sidak corrected alpha for significance. Table 4 displays all the 27 correlations (Kendall’s Tau) and the associated p values.
4.4 End-of-session questionnaire discussion
As the renewal of civil supersonic aviation has the potential to disrupt people’s quality of life, it would be useful to be able to predict how much an individual might be affected by the sonic boom based on personality questionnaires, mostly related to their attitude to noise, that could be conducted easily without the need to expose people to sonic boom. Unfortunately, despite the use of an extensive questionnaire (72 questions), we did not manage to find a question or a subset of questions that would capture participants’ attitude to noise in a way predictive of their responses to the reduced sonic boom. The items in our end-of-session questionnaires have been previously designed by psychologists working on traffic noise, but they still might not have been appropriate for our study because sonic booms are impulsive sounds whereas road, air, and rail traffic mostly involve much more continuous noise. It is especially worth noting that even the rigorously validated NoiSeQ-R questionnaire, developed to measure global noise sensitivity as well as the sensitivity of leisure, work, habitation, communication, and sleep [13, 14], did not correlate with our measurements of participants’ responses to the reduced booms. Future investigations should try to consider the specificity of sonic booms being impulsive noises when putting together questionnaires. Another potential explanation for the lack of correlations between the end-of-session questionnaire and our measurements of participants’ responses to the reduced booms is that our sample of participants is not representative of the French population in terms of sex (only 24.3% of males), age (78% below 46 years old, no children), and education. For the latter, 73.2% of our sample had a Bachelor’s degree or a higher level diploma, which was the case of only 24.8% of the French population in 2020 [23]. Future investigations should reach for larger samples more representative of the population, especially in terms of age and education, and include children.
5 Annoyance, pleasantness and loudness ratings of the booms
5.1 Annoyance ratings
5.1.1 Annoyance ratings procedure
At the beginning and the end of the experimental session, participants listened to the Low Boom and to the High Boom, in the three room conditions, and judged how much they were annoyed, disturbed, or bothered, in absolute terms (by opposition to a situation where they would have been asked to judge the annoyance of the booms in the context of the experimental activities). The order of the room conditions was fixed for convenience: No Rattle, then Living Room, then Kitchen. For each room condition, the order of the booms was randomised. As the participants’ computers were in the living room, they had to write their answers on paper when judging in the kitchen. The questions about the booms followed the recommended French translation of the standardised noise reaction questions (ICBEN: [24]) that uses only one verb (“gêner”) instead of the three English verbs “annoy”, “bother”, and “disturb”. The degrees of annoyance described to the participants were the five verbal labels recommended by the ICBEN: Not at all, Slightly, Moderately, Very, or Extremely) (in French: Pas du tout, Légèrement, Moyennement, Beaucoup, Extrêmement). All the questions were to be answered using a 11-point numerical scale [0:10]. As the ICBEN recommends to ask participants to rate their experience in their own homes during the last 12 months, which was not applicable to our study, we asked participants two different questions: 1) “In absolute terms, how much does this noise bother, disturb, or annoy you?” (so-called « experienced annoyance »), and 2) “And if you were at home, how much do you think this noise would bother, disturb, or annoy you?” (so-called « imagined annoyance »). The French wording of those two questions was: 1) “Dans l’absolu, ce bruit vous gêne-t-il : extrêmement, beaucoup, moyennement, légèrement, pas du tout ?” and 2) Et si vous étiez chez vous, pensez-vous que ce bruit vous gênerait : extrêmement, beaucoup, moyennement, légèrement, pas du tout ?”.
5.1.2 Annoyance ratings data analysis
Annoyance ratings were not normally distributed, so we performed a four-way ART ANOVA [18], with the time (initial ratings completed at the start of the experimental session/final ratings completed at the end of the experimental session), the question (experienced annoyance/imagined annoyance), the applicable boom conditions (Low Boom/High Boom), and the applicable room conditions (No Rattle/Living Room/Kitchen) as independent variables.
5.1.3 Annoyance ratings results
Figure 5 shows the annoyance ratings for the booms. The statistical analysis (all the numerical results are provided in Tab. A2 in Appendix 1) revealed a main effect of the question asked: the booms were judged less annoying when participants were instructed to judge them in isolation than when instructed to imagine hearing them at home. There was also a main effect of the room condition: the booms were judged less annoying in the No Rattle condition than in the two conditions with rattle. The booms were judged less annoying for the Kitchen condition than for the Living Room condition. Two interaction effects were significant: there was an interaction between the time (ratings at the beginning or at the end of the experiment) and the boom condition and an interaction between the time, the boom condition and the room condition. The former two-way interaction points to a pattern of High Booms being judged less annoying than Low Booms at the beginning of the experiment (initial ratings) but being judged more annoying than Low Booms at the end of the experiment (final ratings). The latter three-way interaction seems to point to the fact that the interactive pattern of the former two-way interaction was observed for the Kitchen condition but not observed for the Living Room condition.
 |
Figure 5 Annoyance ratings, as obtained at the beginning of the experimental session (Initial Ratings) and at the end of the experimental session (Final Ratings). Annoyance ratings averaged across participants are plotted for the two questions asked (Experience Annoyance: booms judged as they were perceived in the experiment/Imagined Annoyance: booms judged as if participants were experiencing them in their home), and for the three room conditions. Error bars represent 95% confidence intervals. |
5.1.4 Annoyance ratings discussion
There are two main takeaways from the annoyance ratings results. First, annoyance ratings were higher when participants were asked to imagine hearing the booms in their home than when they were asked to judge them in isolation. Possible explanations are that participants could be concerned by potential damages to their home, by a loss of quality of life (e.g., additional noise exposure, sleep disturbance, less beneficial rest periods), or by a possible depreciation of their house’s value in case of frequent exposure. This should be kept in mind when comparing results between laboratory studies and future field studies.
Second, the booms were more annoying when rattle was present than when it was absent: this confirms that rattle plays a significant role in the perceived annoyance of reduced sonic booms (as pointed in previous studies, notably: [9, 15, 16, 25], for the most recent ones). However, we cannot conclude about the effect of a difference in rattle level as, in our case, a stronger rattle (in the kitchen) was associated with a lower boom level (compared to the living room). Our results may suggest that the boom level difference dominates over the rattle level difference as the annoyance was judged slightly higher in the living room than in the kitchen, but this would need to be checked with further studies. It would therefore be useful during community surveys to inquire whether rattle was perceived as an element of annoyance, and to identify places with similar boom levels but different rattle levels, and vice versa, to tease apart the respective contributions of boom and rattle to annoyance.
It is interesting as well to compare these “absolute” ratings (Fig. 5) with the ratings that characterise different aspects of annoyance in the context of activities (Fig. 2). The former are about one point higher than the latter in the context of tasks. This is in agreement with [26] where the annoyance ratings obtained when participants performed a visual-attention task while being exposed to traffic noise were lower than without the distraction of a task. During that last experimental condition, participants were actually instructed to imagine relaxing in their living room at home. As the “absolute ratings” are half a point higher than the ratings obtained in the context of rest, our study suggests that relaxing rather than imagining it may lead to slightly lower annoyance, though still higher than with a task load.
5.2 Pleasantness ratings
5.2.1 Pleasantness ratings procedure
After collecting annoyance ratings for the first time, we asked participants to rate on a Likert scale [27] the pleasantness of the two booms (Low Boom and High Boom) in the three room conditions, as well as the pleasantness of four short negative sounds and four short positive sounds (selected from the International Affective Digitized Sounds battery (IADS-2; [28]) as references to which to compare the booms. The IADS-2 is a battery of standardised, emotionally-evocative, language-independent sounds pertaining to a wide range of semantic categories, such as environmental sounds (e.g. jackhammer) and human vocalisations (e.g. laughing). Each sound in the IADS-2 has been rated by at least 100 college students on three affective dimensions: valence, arousal, and dominance. The four positive sounds and the four negative sounds in the present study were selected based on their valence norm in the IADS-2. Participants rated the pleasantness of the booms and of the four pleasant and unpleasant IADS-2 sounds [28] on a 7-point Likert scale [27], going from −3 (extremely unpleasant) to +3 (extremely pleasant).
5.2.2 Pleasantness ratings data analysis
To assess differences between sound types (negative sounds/positive sounds/booms), the ratings of the four negative sounds were averaged together, as were the four positive sounds and the six booms (resulting from the combination of the two boom levels with the three room conditions). The average ratings for negative sounds, positive sounds, and for the six booms altogether were all normally distributed so we performed a one-way ANOVA with the sound type (negative/positive/boom) as the independent variable. Then, to assess differences between the booms, and as ratings for each of the six booms were not all normally distributed, we performed a two-way ART ANOVA with the three room conditions and the two boom levels as independent variables.
5.2.3 Pleasantness ratings results
Figure 6 shows the pleasantness ratings for all sounds (negative sounds, positive sounds, and booms). There was a main effect of the sound type (see Tab. A3 in Appendix 1 for statistical details). The booms were judged more unpleasant than the positive sounds, but not more unpleasant than the negative sounds. As for the differences between the booms, there were main effects of the room condition and of the boom level, as well as an interaction effect between the room condition and the boom level. The room condition effect relates to the fact that the booms were judged more unpleasant when rattle was present (kitchen and living room conditions) than when there was no rattle. The boom condition effect relates to the fact that the High Booms were judged more unpleasant than the Low Booms. The interaction effect relates to the fact that the difference between High Booms and Low Booms was larger when there was no rattle than when rattle was present: in the No Rattle condition, the Low Boom was less unpleasant than all the other booms.
 |
Figure 6 Pleasantness ratings, averaged across participants, plotted for each sound stimulus. Error bars represent 95% confidence intervals. |
5.2.4 Pleasantness ratings discussion
There are three takeaways from the pleasantness ratings. First, booms are unpleasant: the booms were judged similarly unpleasant to the four unpleasant sounds that we selected from the IADS-2 database for their negative valence. The second takeaway is that the presence of rattle makes booms more unpleasant: this is consistent with our results for the annoyance ratings, i.e. the unpleasantness results mirror the annoyance discussion in the second paragraph of Section 5.1.4. We also uncovered a relationship between the annoyance ratings and the pleasantness ratings by splitting the participants into two groups based on their annoyance ratings (median split) and by comparing the pleasantness ratings of the two groups (Lower Annoyance group and Higher Annoyance group). There was a main effect of the annoyance group, with sounds being rated as more unpleasant by the Higher Annoyance group than by the Lower Annoyance group, and an interaction between the effect of the annoyance group and the sound type, with a trend for the difference between the two annoyance groups to be the largest for the Booms than for the Negative and Positive sounds. The third takeaway is that the higher boom level makes booms more unpleasant: this was particularly clear for the No Rattle condition. Such an effect of the boom level was not seen for the annoyance ratings. Notably, if we focus on the initial annoyance ratings, which were performed just before the pleasantness ratings, we do not observe differences between the Low Boom and the High Boom conditions (Fig. 5). Future community surveys should seek to replicate the effect of boom level on unpleasantness, possibly for more levels. As a trend for an effect of boom level was also visible for the final annoyance ratings, especially when imagining being at home (Fig. 5), which would be the case in community surveys, they should also investigate the effect of boom level on annoyance ratings.
5.3 Loudness comparison
5.3.1 Loudness comparison procedure
The boom levels were different at the four testing positions (see Fig. 1 and Tab. 1 in [8]). After collecting the pleasantness ratings, we tested the participants’ perception of the level differences in a loudness comparison test. Participants listened to the two booms (Low Boom and High Boom) presented in succession (2-s inter-onset interval) in a random order, and they rated on a 7-points Likert scale the loudness difference between the two booms (from −3 if the first boom was much louder than the second boom, to +3 if the second boom was much louder than the first boom). This loudness comparison was done in the three room/rattle conditions: Kitchen, Living Room, and Living Room with no rattle.
The recent laboratory study by Töpken and van de Par [5] was in agreement with previous results showing that A-weighted sound exposure level (ASEL) is the metric correlating best with loudness evaluations (e.g. [29, 30]). However, as pointed out by the authors themselves in their conclusion, it would be interesting to confirm this in a more ecologically valid context, with in particular room reverberation and rattle. Our experimental design with two boom levels does not allow the determination of a correlation between loudness ratings and physical levels, but at least it can offer the possibility to check whether ASELs are still in good agreement with loudness ratings in a more complex environment.
5.3.2 Loudness comparison data analysis
We computed, for each participant and each of the three room conditions, the percentages of “consistent” responses, “inconsistent” responses, and “equal” responses. “Consistent” responses corresponded to strictly negative ratings when the first boom of the pair of booms presented had the higher level, and to strictly positive ratings when the second boom of the pair of booms presented had had the higher level. “Inconsistent” responses were the opposite of “consistent” responses. “Equal” responses were the zero ratings indicating that participants could not hear the level difference between the Low Boom and the High Boom.
5.3.3 Loudness comparison results
Figure 7 plots, for each room condition, the percentage of participants who either reported a loudness difference consistent with the sound level difference between the booms, a loudness difference inconsistent with the sound level difference between the booms, or who judged the booms to be equally loud. This figure shows that most participants perceived a difference in loudness that was consistent with the differences in ASEL values. However, there were differences between room conditions: fewer participants gave a consistent response in the Living Room condition than in the No Rattle condition, and fewer participants gave a “consistent” response in the Kitchen condition than in the Living Room condition. The reverse was observed for “equal” responses: more participants gave an equal response in the Living Room condition than in the No Rattle condition, and more participants gave an “equal” response in the Kitchen condition than in the Living Room condition. More participants gave an “inconsistent” response in the Kitchen condition than in the Living Room and No Rattle conditions. These differences between room conditions were consistent with the boom level differences (re. A weighted level) across room conditions. As indicated in Table 1 of Marmel et al. [8] and reported on the x-axis of Figure 7, the boom level difference was slightly smaller in the Living Room condition than in the No Rattle condition, and, in the Kitchen, the boom level difference was very small.
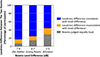 |
Figure 7 Loudness comparison. For each room condition, the level difference (in dB re. A-weighted level) between booms are indicated for the two participants’ testing positions separated by a hyphen. |
5.3.4 Loudness comparison discussion
We added this task to the protocol because we noticed that the two boom levels sounded barely different in the Kitchen condition, even though we could clearly hear the level difference in the two Living Room conditions. Our perception was consistent with the level differences measured between the two booms using the ASEL metric, and we reasoned that observing the same perception pattern in participants would be evidence vindicating the use of this metric as part of the metrics pre-selected by the SuperSonic Transport Group (SSTG) from International Civil Aviation Organisation (ICAO) [30] for reduced sonic booms. Overall, participants shared our experience: in the kitchen, only 56.1% of the participants reported a loudness difference consistent with the level difference, whereas they were 75.6% in the Living Room condition and 82.9% in the No Rattle condition. We can thus conclude that loudness differences for reduced sonic booms are consistent with ASEL values, showing an agreement with Töpken and van de Par [5] even in a more complex environment.
6 Conclusion
This paper deals with the second part of an experimental study which was designed to explore the influence of reduced sonic boom on humans while being involved in various activities in a natural environment (a typical European house). While the first part [8] was mainly about the influence of the booms on the performance during three tasks (motor control, working memory and conversation), this second part was dedicated to perceived boom interference, which was tested via a series of short questionnaires at the end of the three tasks as well as after three mandatory rest periods, in order to potentially relate boom interference to the performance and investigate how the interference is affected by the type of activity. We were also interested in how booms were more directly perceived in absolute terms (outside the context of an activity), and so participants had to rate the annoyance, pleasantness and compare the loudness of the booms. And last, participants had to fill out a questionnaire so we could look for links between their perception of boom interference and their noise sensitivity.
The results as well as the limitation of our study lead us to make the following conclusions and recommendations:
The negative interference of reduced sonic booms is greater when people are trying to rest than when they are focusing on a task. Future studies should investigate the impact of booms on resting activities such as passively watching TV or listening to music. It is also very important that future studies investigate whether and how reduced sonic booms interfere with sleep.
Future studies should focus on the fatigue and the stress caused by the booms. Physiological measures of stress, for example based on heart rate variability, could be useful.
Perceived interference is not necessarily consistent with performance degradation. As a negative perception might potentially lead to some negative effects in the long run, both aspects (performance and interference) need to be taken into account in future studies to capture all possible negative effects of the booms on humans in their daily life.
Annoyance, pleasantness and loudness ratings are higher with an increased ASEL. However, as more rattle was linked to a lower level in the case of our experiment, more indoor studies in ecological setups are needed to clarify and quantify the respective contributions of boom and rattle noise on the different perceptual descriptors used in urban noise research. They would need to be conducted in various contexts, while varying independently the rattle noise and the boom levels.
Current state-of-the-art questionnaires on noise sensitivity, including traffic noise sensitivity, are not predictive of human responses to reduced sonic booms. More research is needed on that front.
The present study focused on adults, yet exposure to ground and air traffic noise has consistently been reported to have negative consequences on cognitive performance in children [31]. It may be worth considering repeating or adapting the present study with children participants, so as to compare their sensitivity to reduced booms with adults.
The present study could only investigate the effect of exposure on multiple booms during a limited period of time (one afternoon) for adult participants. It is therefore impossible to draw any conclusion about the effect of long-term, chronic boom exposure. Future studies should include community surveys lasting several weeks in order to gain understanding of the effects of chronic exposure to reduced booms.
Acknowledgments
The RUMBLE (acronym for “RegUlation and norM for low sonic Boom Level”) project received funding from the European Union’s Horizon 2020 research and innovation programme (Societal Challenges – Transport) under Grant Agreement No. 769896. This document reflects only the authors’ view and the Commission is not responsible for any use that may be made of the information it contains. We thank our colleagues in RUMBLE for the exchange during the preparation of this study, and in particular the project coordinator Jean-François Perelgritz (Airbus France) and Pierre-Elie Normand (Dassault-Aviation) for sharing the software computing various boom metrics. Philippe Guibert, head of campus St Cyr of Sorbonne Université and Pierre-Yves Lagrée, director of Institut Jean Le Rond d’Alembert, are thanked for giving us access to the test house for research purposes. The technical and administrative assistance of Jean-François Egéa, Jérôme Péquin, Jean-Marie Citerne, Hugo Dutilleul and Evelyne Mignon, all from Institut Jean Le Rond d’Alembert at Sorbonne Université was essential to carry out this study successfully.
Conflicts of interest
The authors declare no conflict of interest.
Data availability statement
The data are available from the corresponding author on request.
References
- L. Cretagne, C. Garcia Armijos, R. Leconte, F. Ollivier, J. Marchal, F. Marmel, C. Fritz, F. Coulouvrat: Design of a low frequency, impulsive sound simulator in an existing house for sonic boom perceptual studies. Acta Acustica 7 (2023) 61. [CrossRef] [EDP Sciences] [Google Scholar]
- A. Loubeau, J. Page: Human perception of sonic booms from supersonic aircraft. Acoustics Today 14, 3 (2018) 23–30. [Google Scholar]
- D. Carr, P. Davies, A. Loubeau, J. Rathsam, J. Klos: Influences of low-frequency energy and testing environment on annoyance responses to supersonic aircraft noise when heard indoors, Journal of the Acoustical Society of America 148, 1 (2020) 414–429. [CrossRef] [PubMed] [Google Scholar]
- J. Rathsam, J. Klos, A. Loubeau, D.J. Carr, P. Davies: Effects of chair vibration on indoor annoyance ratings of sonic booms. Journal of the Acoustical Society of America 143, 1 (2018) 489–499. [CrossRef] [PubMed] [Google Scholar]
- S. Töpken, S. van de Par: Loudness and short-term annoyance of sonic boom signatures at low levels. Journal of the Acoustical Society of America 149, 3 (2021) 2004–2015. [CrossRef] [PubMed] [Google Scholar]
- A. Loubeau: Community response to low-amplitude sonic booms. Proceedings of Meetings on Acoustics 19, 1 (2013) 040048. [CrossRef] [Google Scholar]
- J. A. Page, K. K. Hodgdon, R. P. Hunte, D. E. Davis, T. A. Gaugler, R. Downs, R. A. Cowar, D. J. Maglieri, C. Hobbs, G. Baker, M. Collmar, K. E. Bradley, B. Sonak, D. Crom, C Cutler: Quiet supersonic flights 2018 (QSF18) test: Galveston, Texas risk reduction for future community testing with a low-boom flight demonstration vehicle, NASA-CR-2020-220589 (Volume 1), 2020. [Google Scholar]
- F. Marmel, L. Cretagne, L.T. Thuong, F. Coulouvrat, C. Fritz: Impact of reduced sonic boom exposure on psychophysical and cognitive performance for simulated booms presented in a realistic indoor environment. Acta Acustica 8 (2024) 1. [CrossRef] [EDP Sciences] [Google Scholar]
- J.M. Fields: Reactions of residents to long-term sonic boom noise environments. Technical report, NASA CR-201704, 1997. [Google Scholar]
- D.A. McCurdy, S.A. Brown, R.D. Hilliard: Subjective response of people to simulated sonic booms in their homes. Journal of the Acoustical Society of America 116, 3 (2004) 1573–1584. [CrossRef] [PubMed] [Google Scholar]
- G.W. Evans, R. Stecker: Motivational consequences of environmental stress, Journal of Environmental Psychology 24, 2 (2004) 143–165. [CrossRef] [Google Scholar]
- O. Hahad, J.H. Prochaska, A. Daiber, T. Muenzel: Environmental noise‐induced effects on stress hormones, oxidative stress, and vascular dysfunction: Key factors in the relationship between cerebrocardiovascular and psychological disorders. Oxidative Medicine and Cellular Longevity 1, 1 (2019) 4623109. [Google Scholar]
- B. Griefahn: Determination of noise sensitivity within an internet survey using a reduced version of the noise sensitivity questionnaire. Journal of the Acoustical Society of America 123, 5 (2008) 3449. [CrossRef] [Google Scholar]
- M. Schütte, A. Marks, E. Wenning, B. Griefahn: The development of the noise sensitivity questionnaire. Noise Health 9, 34 (2007) 15–24. [CrossRef] [PubMed] [Google Scholar]
- J. Rathsam, A. Loubeau, J. Klos: Effects of indoor rattle sounds on annoyance caused by sonic booms. Journal of the Acoustical Society of America 138, 1 (2015) EL43–EL48. [CrossRef] [PubMed] [Google Scholar]
- A. Loubeau: Evaluation of the effect of aircraft size on indoor annoyance caused by sonic booms and rattle noise. Journal of the Acoustical Society of America 143, 3 (2018) 1936. [CrossRef] [Google Scholar]
- R. Guski, U. Felscher-Suhr, R. Schuemer: The concept of noise annoyance: How international experts see it. Journal of Sound and Vibration 223 (1999) 513–527. [Google Scholar]
- J.O. Wobbrock, L. Findlater, D. Gergle, J.J. Higgins: The Aligned Rank Transform for nonparametric factorial analyses using only ANOVA procedures, in: Proceedings of the ACM Conference on Human Factors in Computing Systems (CHI ‘11). Vancouver, British Columbia (May 7–12, 2011), ACM Press: New York, 2011:143–146. [Google Scholar]
- S.J. Fard, A.P. Lavender: A comparison of task-based mental fatigue between healthy males and females. Fatigue: Biomedicine, Health & Behavior 7, 1 (2019) 1–11. [CrossRef] [Google Scholar]
- R.A. Stern, J.E. Arruda, C.R. Hooper, G.D. Wolfner, C.E. Morey: Visual analogue mood scales to measure internal mood state in neurologically impaired patients: description and initial validity evidence. Aphasiology 11, 1 (1997) 59–71. [CrossRef] [Google Scholar]
- C.W. Nixon, P.N. Borsky: Effects of Sonic Booms on People: St. Louis, Missouri, 1961–1962, Aerospace Medical Res. Lab. Rept., AMRL-Rept. TR-65-196, 1965. [CrossRef] [Google Scholar]
- D.A. Hilton, V. Huckel, R. Steiner, D.J. Maglieri: Sonic-boom exposures during FAA community response studies over a six-month period in the Oklahoma City area, Technical report. NASA TN D-2539, 1964. [Google Scholar]
- INSEE: 2020. https://www.insee.fr/fr/statistiques/2416872#tableau-figure1_radio1. Consulted on 04/04/2021. [Google Scholar]
- T. Gjestland: Standardized general-purpose noise reaction questions, in: 12th ICBEN Congress on Noise as a Public Health Problem, 2017. [Google Scholar]
- K. Hodgdon, J. Page, T. Gaugler, D. Phillips, D. Shumway, J. Rosenberger: Statistical analysis of community response to low amplitude sonic boom noise, in: Proceedings of Meetings on Acoustics ICA2013 (Vol. 19, No. 1, p. 040046), Acoustical Society of America, 2013. [Google Scholar]
- W. Ellermeier, F. Kattner, E. Klippenstein, M. Kreis, C. Marquis-Favre: Short-term noise annoyance and electrodermal response as a function of sound-pressure level, cognitive task load, and noise sensitivity. Noise Health 22 (2020) 46–55. [PubMed] [Google Scholar]
- R. Likert: A technique for the measurement of attitudes. Archives of Psychology 140 (1932) 1–55. [Google Scholar]
- M.M. Bradley, P.J. Lang: The International Affective Digitized Sounds (2nd Edition; IADS-2): Affective ratings of sounds and instruction manual. Tech. Rep. B-3., Gainesville, FL: University of Florida, 2007. [Google Scholar]
- B.M. Sullivan: Human response to simulated low-intensity sonic booms, Proceedings of Noise-Con 2004, Baltimore, MD 1 (2004) 1–10. [Google Scholar]
- A. Loubeau, Y. Naka, B.G. Cook, V.W. Sparrow, J.M. Morgenstern: A new evaluation of noise metrics for sonic booms using existing data. AIP Conference Proceedings 1685 (2015) 090015 (1–4). [CrossRef] [Google Scholar]
- M. Klatte, K. Bergström, T. Lachmann: Does noise affect learning? A short review on noise effects on cognitive performance in children. Frontiers in Psychology 4 (2013) 578 (1–6). [CrossRef] [PubMed] [Google Scholar]
Cite this article as: Marmel F. Cretagne L. Thuong L. Coulouvrat F. & Fritz C, et al. 2025 Impact of reduced sonic boom exposure on introspective judgments and annoyance, pleasantness and loudness ratings for simulated booms presented in a realistic indoor environment. Acta Acustica, 9, 8. https://doi.org/10.1051/aacus/2024083.
Appendix 1: Statistical analyses
The effect sizes of significant effects are given as partial eta-squared (ηp2).
Questionnaires after the tasks and the rest periods (Sect. 3.1)
Details of the statistical results in Section 3.1: significant effects on the ratings provided in reply to the “indirect effect” questions (analyses 1 and 3) and to the “direct effect” questions (analyses 2 and 4).
Annoyance ratings (Sect. 5.1)
Details of the statistical results in Section 5.1: significant effects on the annoyance ratings.
Pleasantness ratings (Sect. 5.2)
Details of the statistical results in Section 4.2: significant effects on the pleasantness ratings.
Appendix 2: List of questions asked after each short run of the psychophysical tasks and after each rest period, in their original French language
CONCERNANT LA TÂCHE:
Avez-vous eu besoin de vous concentrer très fort pour faire la tâche ?
Avez-vous eu besoin de faire beaucoup d’effort pour faire la tâche ?
CONCERNANT LES « BOUMS » :
À quel point vous ont-ils gêné·e pour faire la tâche ?
À quel point vous ont-ils paru désagréables ?
Les avez-vous trouvés forts ?
Avez-vous pu facilement les ignorer ?
Vous ont-ils surpris·e ou fait sursauter ?
CONCERNANT LE « RATTLE » (vibrations, claquements, ou secousses survenant quand des objets bougent par vibration) :
Avez-vous constaté la présence de rattle causé par les « boums » ?
À quel point vous a-t-il gêné·e pour faire la tâche ?
À quel point vous a-t-il paru désagréable ?
L’avez-vous trouvé fort ?
Avez-vous pu facilement l’ignorer ?
Vous a-t-il surpris·e ou fait sursauter ?
Appendix 3: End-of-session questionnaire


All Tables
List of questions asked after each short run of the psychophysical tasks (all of them) and after each rest period (“direct effect” questions only), as well as the associated labels used in Figure 2. The questions were always asked in the following order: “indirect effect” questions (1–2), “direct effect” questions about the booms (1–6), and “direct effect” questions about the rattle noise (1–6).
Information about the four statistical analyses: research questions, dependent and independent variables, and number of participants.
Correlations between the selected extracts from the end-of-session questionnaire and the selected experimental measurements.
Details of the statistical results in Section 3.1: significant effects on the ratings provided in reply to the “indirect effect” questions (analyses 1 and 3) and to the “direct effect” questions (analyses 2 and 4).
Details of the statistical results in Section 5.1: significant effects on the annoyance ratings.
Details of the statistical results in Section 4.2: significant effects on the pleasantness ratings.
All Figures
|
Figure 1 Flow chart of the experimental session, depicting all activities. The ellipses indicate the 4 activities (3 psychophysical tasks and rest periods), and the solid rectangles depict the questionnaires and ratings. |
| In the text | |
|
Figure 2 Questionnaires completed after each run of the tasks and after the rests. Answers were averaged across participants. The full range for all response scales is from 0 to 10. Error bars represent 95% confidence intervals. “Direct effect” questions are in Figure 2A and “indirect effect” questions are in Figure 2B. |
| In the text | |
|
Figure 3 The four mood scales, as displayed on the graphical interface, but with all the text translated to English. |
| In the text | |
|
Figure 4 Mood shifts during the rest periods, averaged across participants. Greater positive valued mood shifts indicate shifts toward more positive moods. As the mood scales ranged from 0 to 100, the mood shifts’ full range is from −100 to 100. Error bars represent 95% confidence intervals. |
| In the text | |
|
Figure 5 Annoyance ratings, as obtained at the beginning of the experimental session (Initial Ratings) and at the end of the experimental session (Final Ratings). Annoyance ratings averaged across participants are plotted for the two questions asked (Experience Annoyance: booms judged as they were perceived in the experiment/Imagined Annoyance: booms judged as if participants were experiencing them in their home), and for the three room conditions. Error bars represent 95% confidence intervals. |
| In the text | |
|
Figure 6 Pleasantness ratings, averaged across participants, plotted for each sound stimulus. Error bars represent 95% confidence intervals. |
| In the text | |
|
Figure 7 Loudness comparison. For each room condition, the level difference (in dB re. A-weighted level) between booms are indicated for the two participants’ testing positions separated by a hyphen. |
| In the text | |
Current usage metrics show cumulative count of Article Views (full-text article views including HTML views, PDF and ePub downloads, according to the available data) and Abstracts Views on Vision4Press platform.
Data correspond to usage on the plateform after 2015. The current usage metrics is available 48-96 hours after online publication and is updated daily on week days.
Initial download of the metrics may take a while.