Figure 10
Download original image
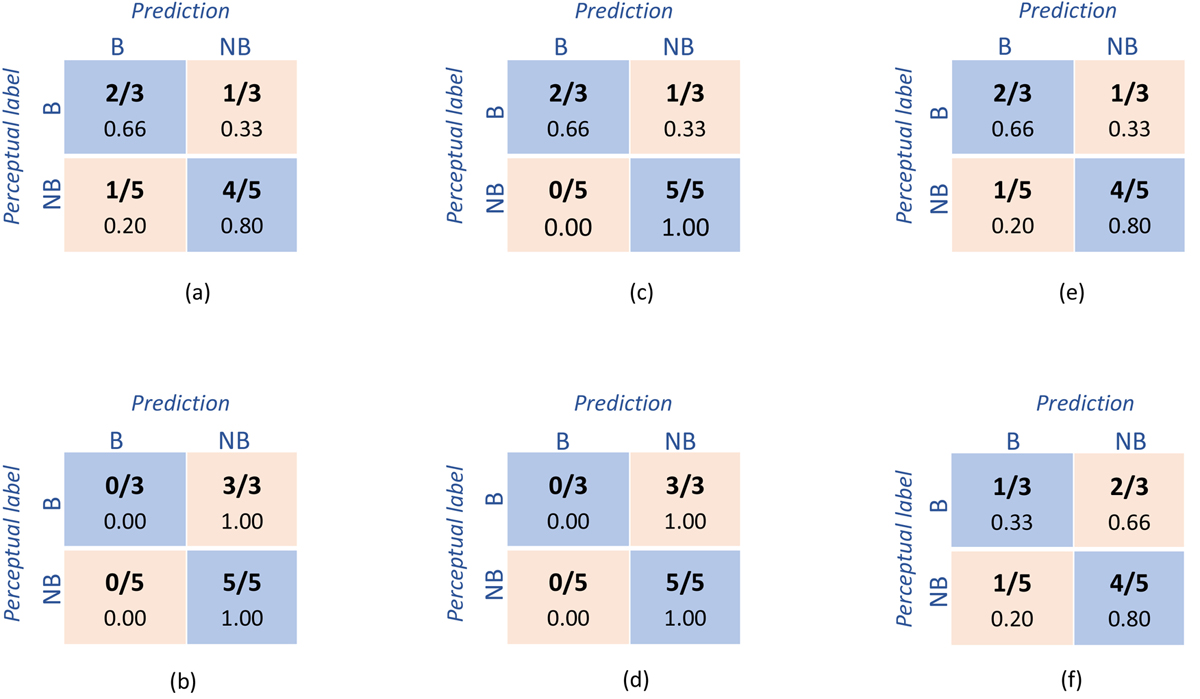
Confusion matrices depicting the correct and misclassification rates of the six transformation models trained and validated using separate train and test samples, (number of test samples n = 8). (a) PCA transformed raw MFCC, (b) PCA transformed standardized MFCC, (c) LDA transformed raw MFCC, (d) LDA transformed standardized MFCC, (e) t-SNE transformed raw MFCC and (f) t-SNE transformed standardized MFCC.
Current usage metrics show cumulative count of Article Views (full-text article views including HTML views, PDF and ePub downloads, according to the available data) and Abstracts Views on Vision4Press platform.
Data correspond to usage on the plateform after 2015. The current usage metrics is available 48-96 hours after online publication and is updated daily on week days.
Initial download of the metrics may take a while.