Open Access
Figure 3
Download original image
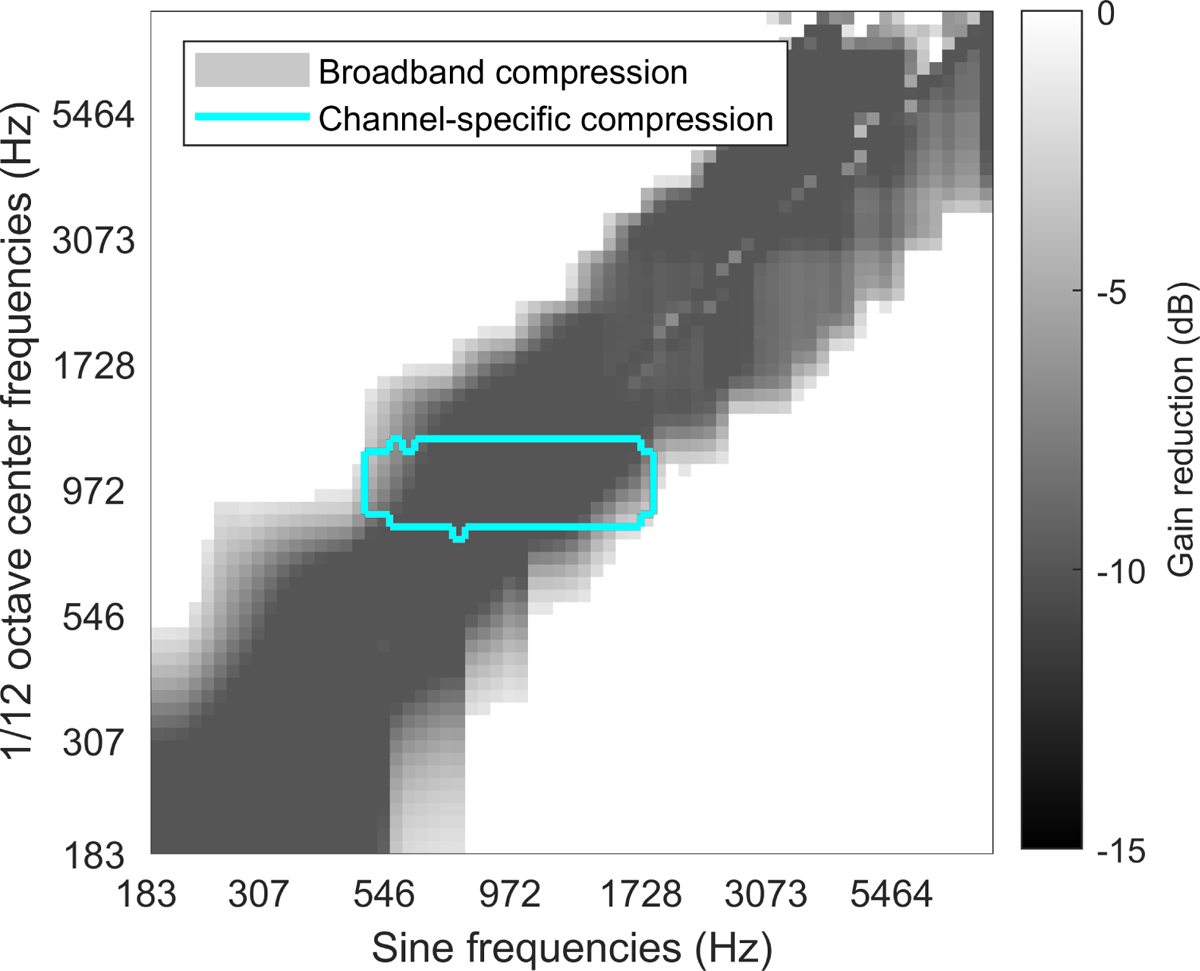
Example of combining results measured with broadband and channel-specific compression for the medium technology level of manufacturer A and hearing aids channel 5. The grayscale plot represent the results measured with broadband, and the blue contour the results measured with channel-specific compression.
Current usage metrics show cumulative count of Article Views (full-text article views including HTML views, PDF and ePub downloads, according to the available data) and Abstracts Views on Vision4Press platform.
Data correspond to usage on the plateform after 2015. The current usage metrics is available 48-96 hours after online publication and is updated daily on week days.
Initial download of the metrics may take a while.