Open Access
Figure 3
Download original image
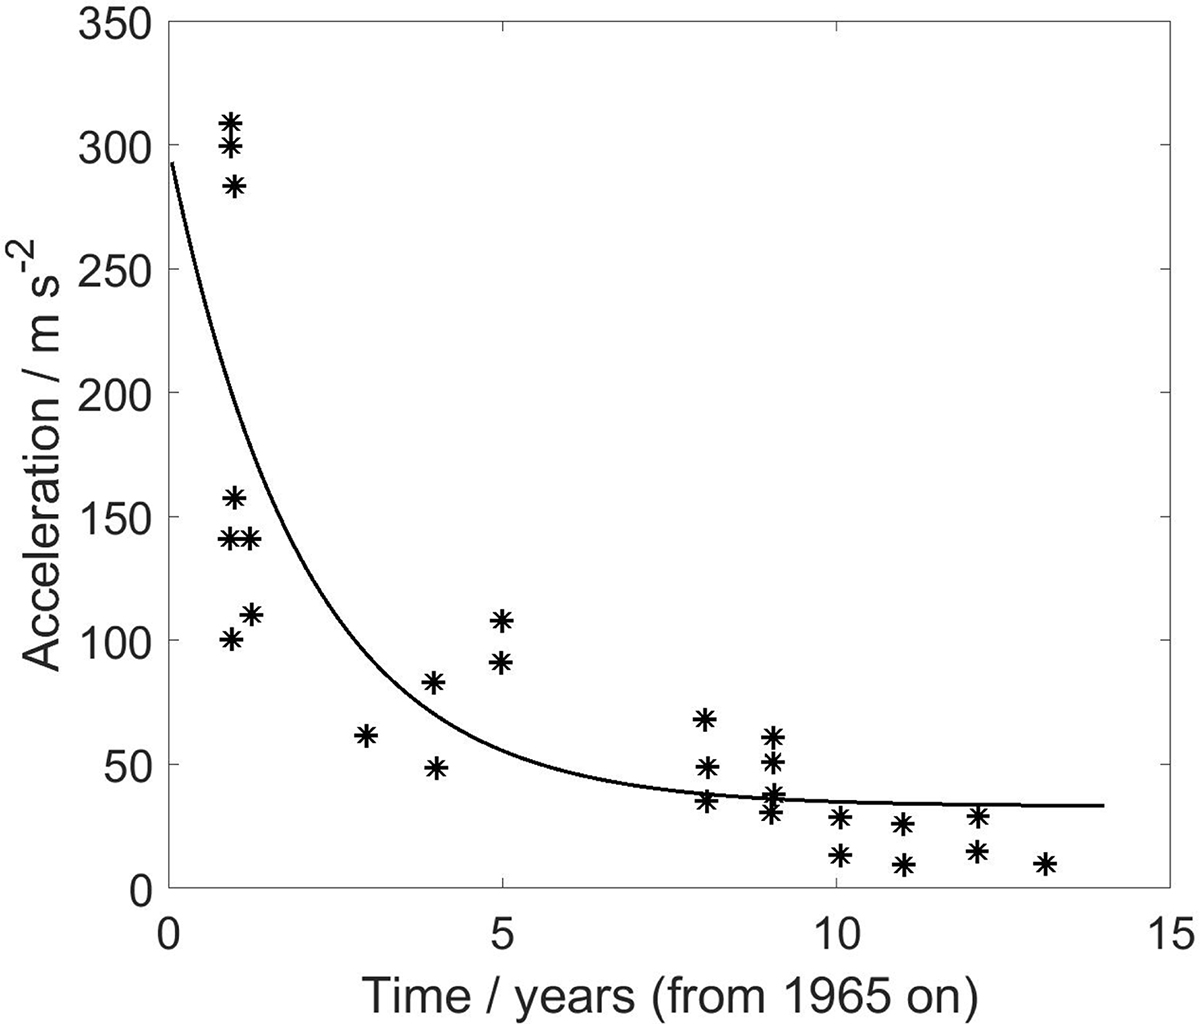
Reduction in the acceleration at chain saw handles over time where time 0 represents the year 1965, the measured accelerations is shown as asterisks, and the fit of the curve is based on equation (5).
Current usage metrics show cumulative count of Article Views (full-text article views including HTML views, PDF and ePub downloads, according to the available data) and Abstracts Views on Vision4Press platform.
Data correspond to usage on the plateform after 2015. The current usage metrics is available 48-96 hours after online publication and is updated daily on week days.
Initial download of the metrics may take a while.