Open Access
Figure 6
Download original image
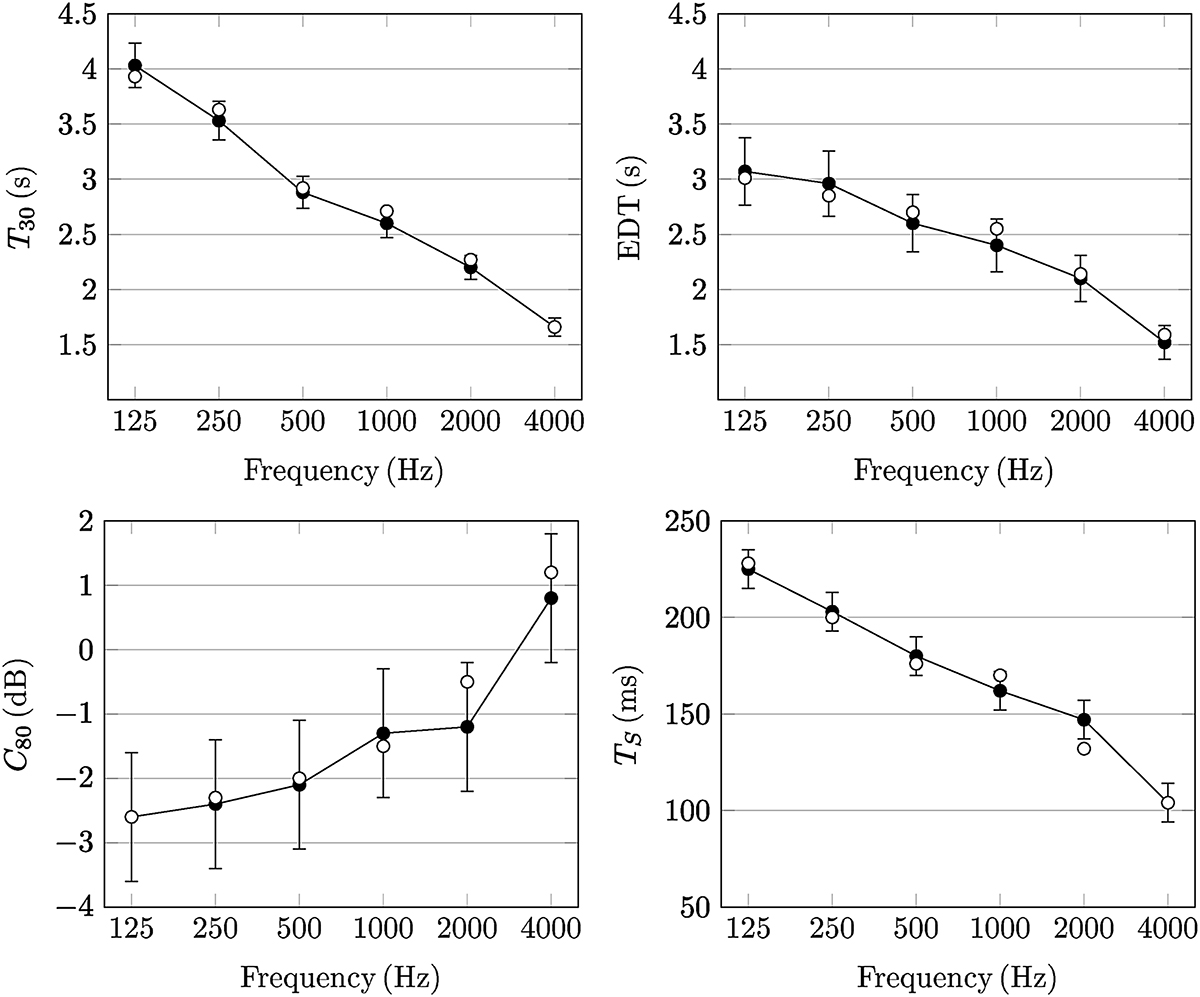
Calibration results: comparison between experimental data (black) and numerical simulations (white) through GA techniques (Odeon). Values have been averaged over all the receivers in the main octangular hall and refer to sound source S1 (see Fig. 2).
Current usage metrics show cumulative count of Article Views (full-text article views including HTML views, PDF and ePub downloads, according to the available data) and Abstracts Views on Vision4Press platform.
Data correspond to usage on the plateform after 2015. The current usage metrics is available 48-96 hours after online publication and is updated daily on week days.
Initial download of the metrics may take a while.