Figure 4
Download original image
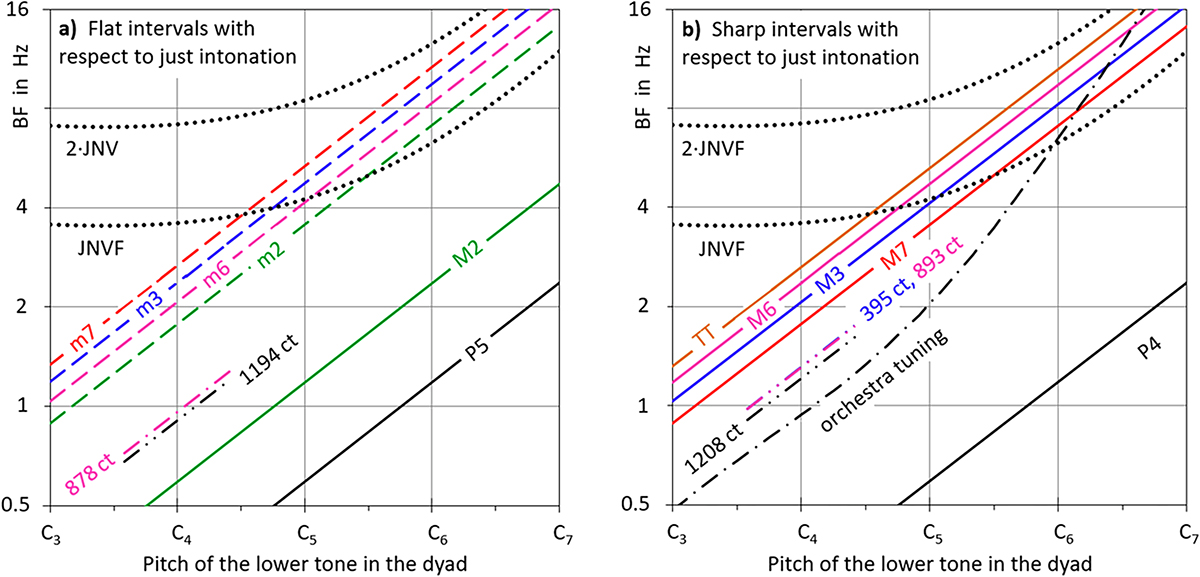
This graphical representation illustrates the relationship between the beat frequencies and the pitch of the lower tone of the dyads listed in Table 1. Chart (a) depicts all dyads tuned flat with respect to just intonation, while chart (b) contains the sharp intervals. The lower dotted curve represents the JNVF; beyond 2∙JNVF detuning becomes obvious. Most dyads in 12-TET are tuned so far from just intonation that they exceed the range of one JNVF. The dash-dotted straight lines represent the results of experiments with harmonic complex tones (3 dB/8ve spectral roll-off). In these experiments, listeners adjusted the upper tone of three dyads (M3, M6, P8) until the interval achieved the highest “pleasantness” while the lower tone fixed in the pitch range G3…F4 [2]. The resulting dyads are a flat m6 (878 ct), a flat octave (1194 ct), a sharp M3 (395 ct), a sharp M6 (893 ct) and a sharp octave (1208 ct). The dash-dotted curve represents the preferred average of pitch-dependent octave stretching for orchestra instruments with harmonic partials (Fig. 2 in [19]). It should be noted that for octaves, whose lower pitch is higher than B6, the octaves are enlarged by more than one JNVF in this tuning.
Current usage metrics show cumulative count of Article Views (full-text article views including HTML views, PDF and ePub downloads, according to the available data) and Abstracts Views on Vision4Press platform.
Data correspond to usage on the plateform after 2015. The current usage metrics is available 48-96 hours after online publication and is updated daily on week days.
Initial download of the metrics may take a while.