Figure 4
Download original image
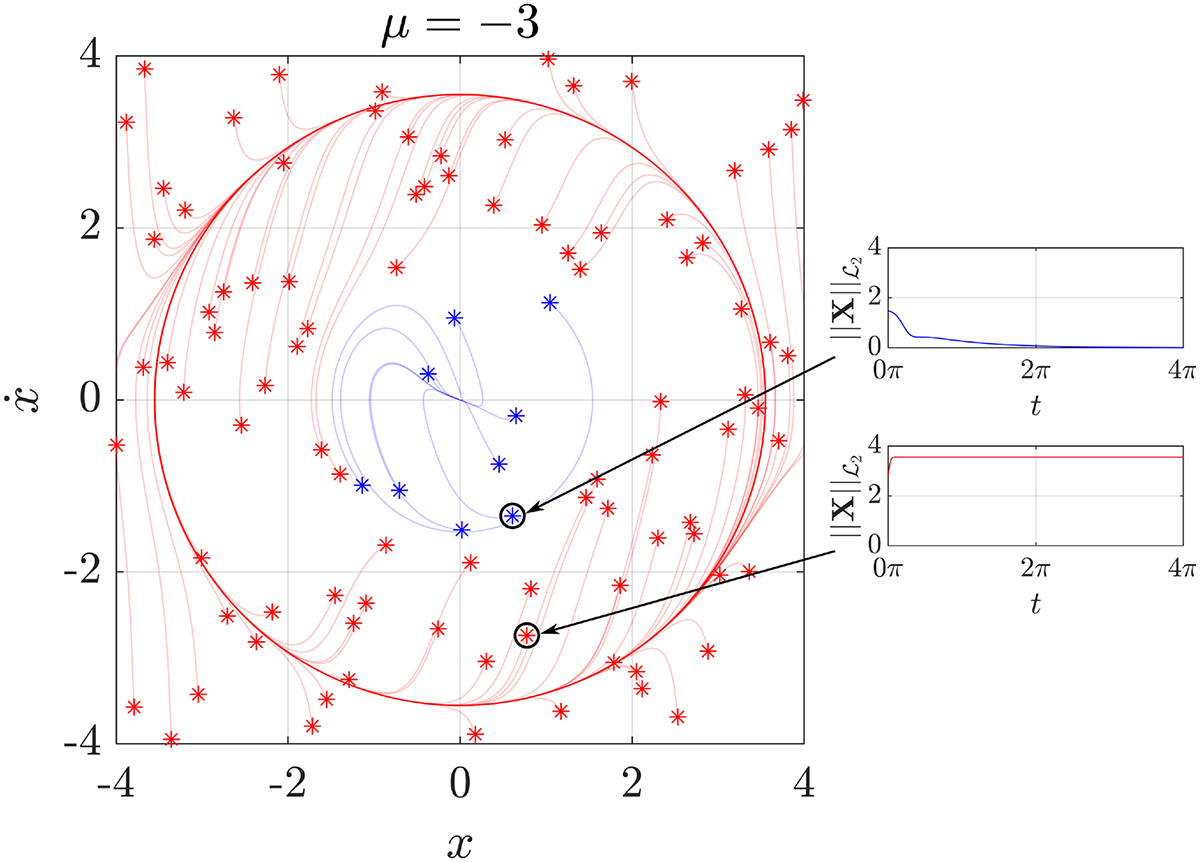
Illustration of the classification method in the general case. The plotted trajectories are obtained with time integrations starting from the stars as initial conditions. Red trajectories are inside the basin of attraction of the stable periodic solution X2π+ whereas the blue ones belong to the basin of the equilibrium XEq.
Current usage metrics show cumulative count of Article Views (full-text article views including HTML views, PDF and ePub downloads, according to the available data) and Abstracts Views on Vision4Press platform.
Data correspond to usage on the plateform after 2015. The current usage metrics is available 48-96 hours after online publication and is updated daily on week days.
Initial download of the metrics may take a while.