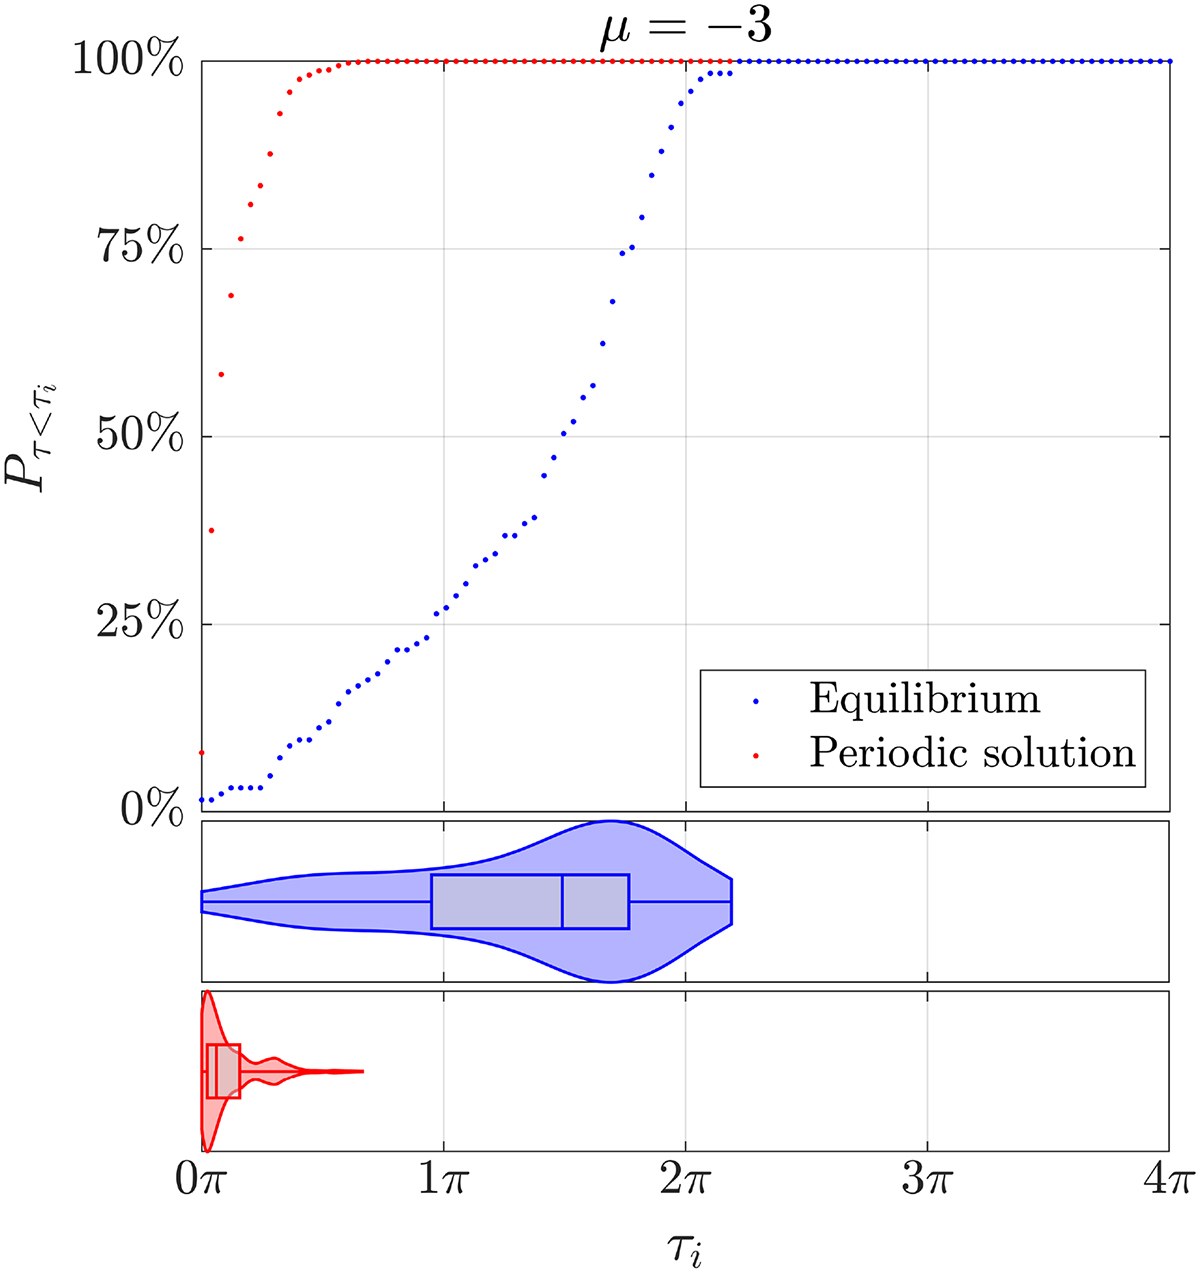
Figure 7

Download original image
(Top) Cumulative probability function of the transient duration distribution. In ordinate, the proportion of trajectories with a transient duration below the value given in abscissa. (Bottom) Corresponding violin plots. The box plots indicate the extreme values, the median, the upper and lower quartiles whereas the curves around represent the probability density function of the transient duration distribution. A latin hypercube of 1000 samples is used and the transient durations are defined with ε = 0.1.
Current usage metrics show cumulative count of Article Views (full-text article views including HTML views, PDF and ePub downloads, according to the available data) and Abstracts Views on Vision4Press platform.
Data correspond to usage on the plateform after 2015. The current usage metrics is available 48-96 hours after online publication and is updated daily on week days.
Initial download of the metrics may take a while.


