Figure 14
Download original image
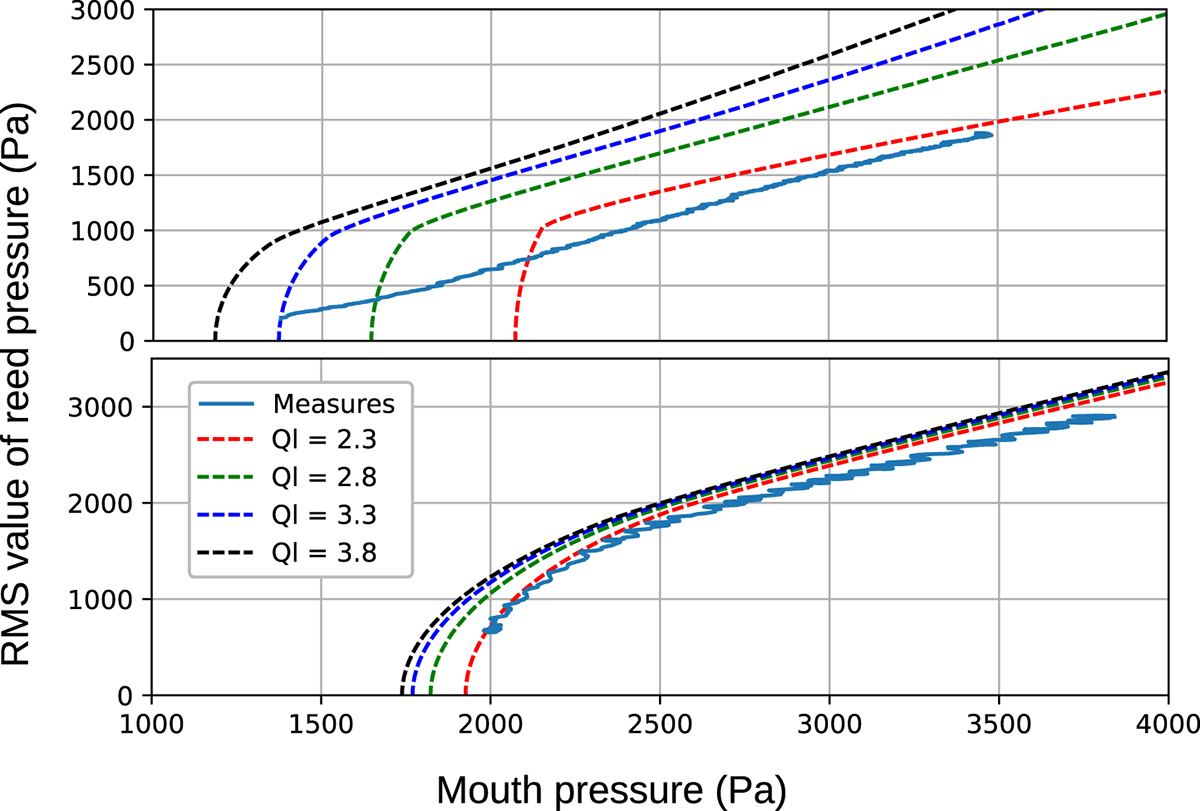
Experimental and theoretical bifurcation diagrams for fingering C+1 (top) and C (bottom). The dashed lines represent the bifurcation diagrams for different values of the reed quality factor obtained with physical parameters H = 0.30 mm, K = 15 MPa · m−1, Fr = 480 Hz and, from right to left, Qr = 2.3, 2.8, 3.3, 3.8. The plain lines represent the measurements.
Current usage metrics show cumulative count of Article Views (full-text article views including HTML views, PDF and ePub downloads, according to the available data) and Abstracts Views on Vision4Press platform.
Data correspond to usage on the plateform after 2015. The current usage metrics is available 48-96 hours after online publication and is updated daily on week days.
Initial download of the metrics may take a while.