Figure 2
Download original image
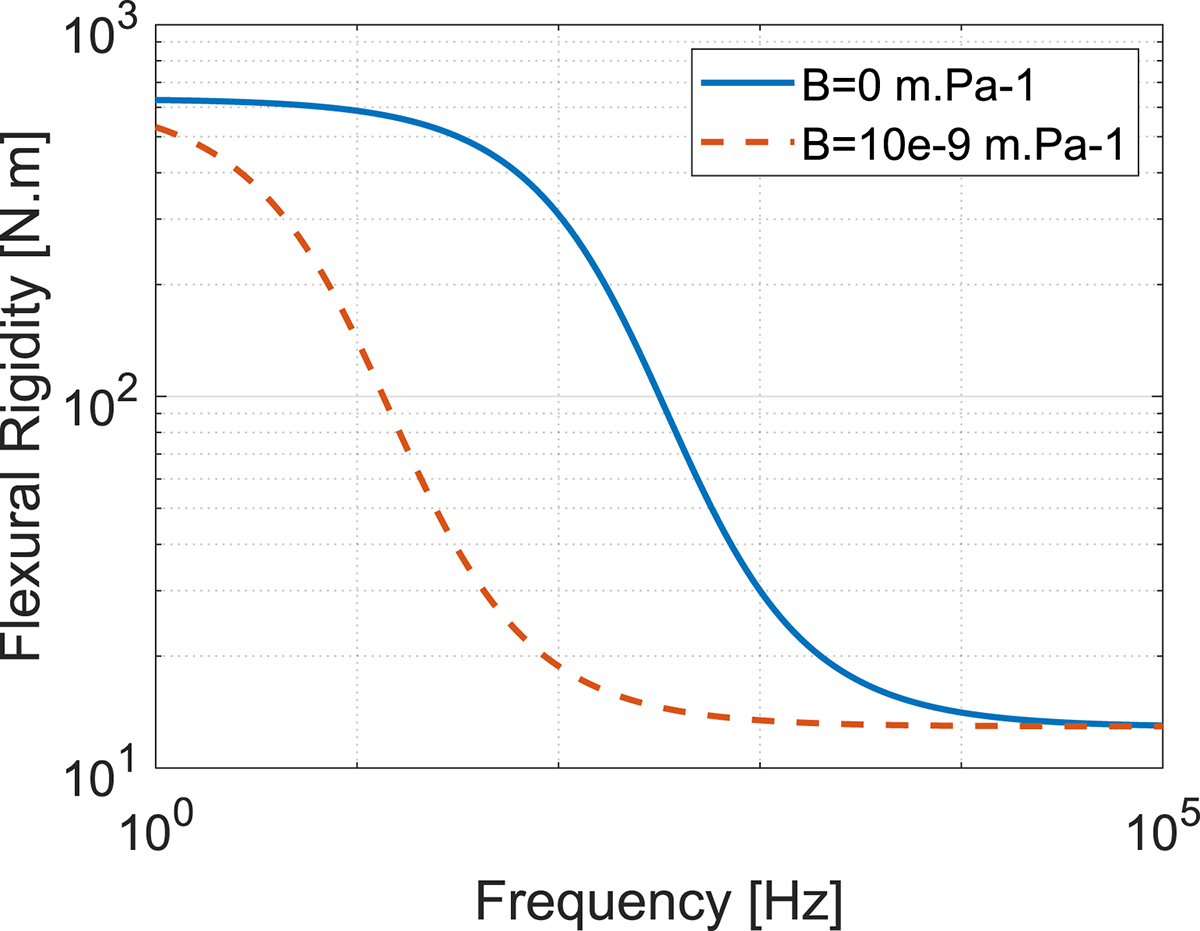
Flexural rigidity with respect to the frequency for two different interface conditions. For the blue curve, the simulation has been done with B = 0 m.Pa−1, which is a perfect interface structure. The red dotted line has been done with the same material but with imperfect interfaces with B = 10e−9 m.Pa−1 = 1e−8 m.Pa−1. The material properties for this example are gathered in Table 1.
Current usage metrics show cumulative count of Article Views (full-text article views including HTML views, PDF and ePub downloads, according to the available data) and Abstracts Views on Vision4Press platform.
Data correspond to usage on the plateform after 2015. The current usage metrics is available 48-96 hours after online publication and is updated daily on week days.
Initial download of the metrics may take a while.