Open Access
Figure 6
Download original image
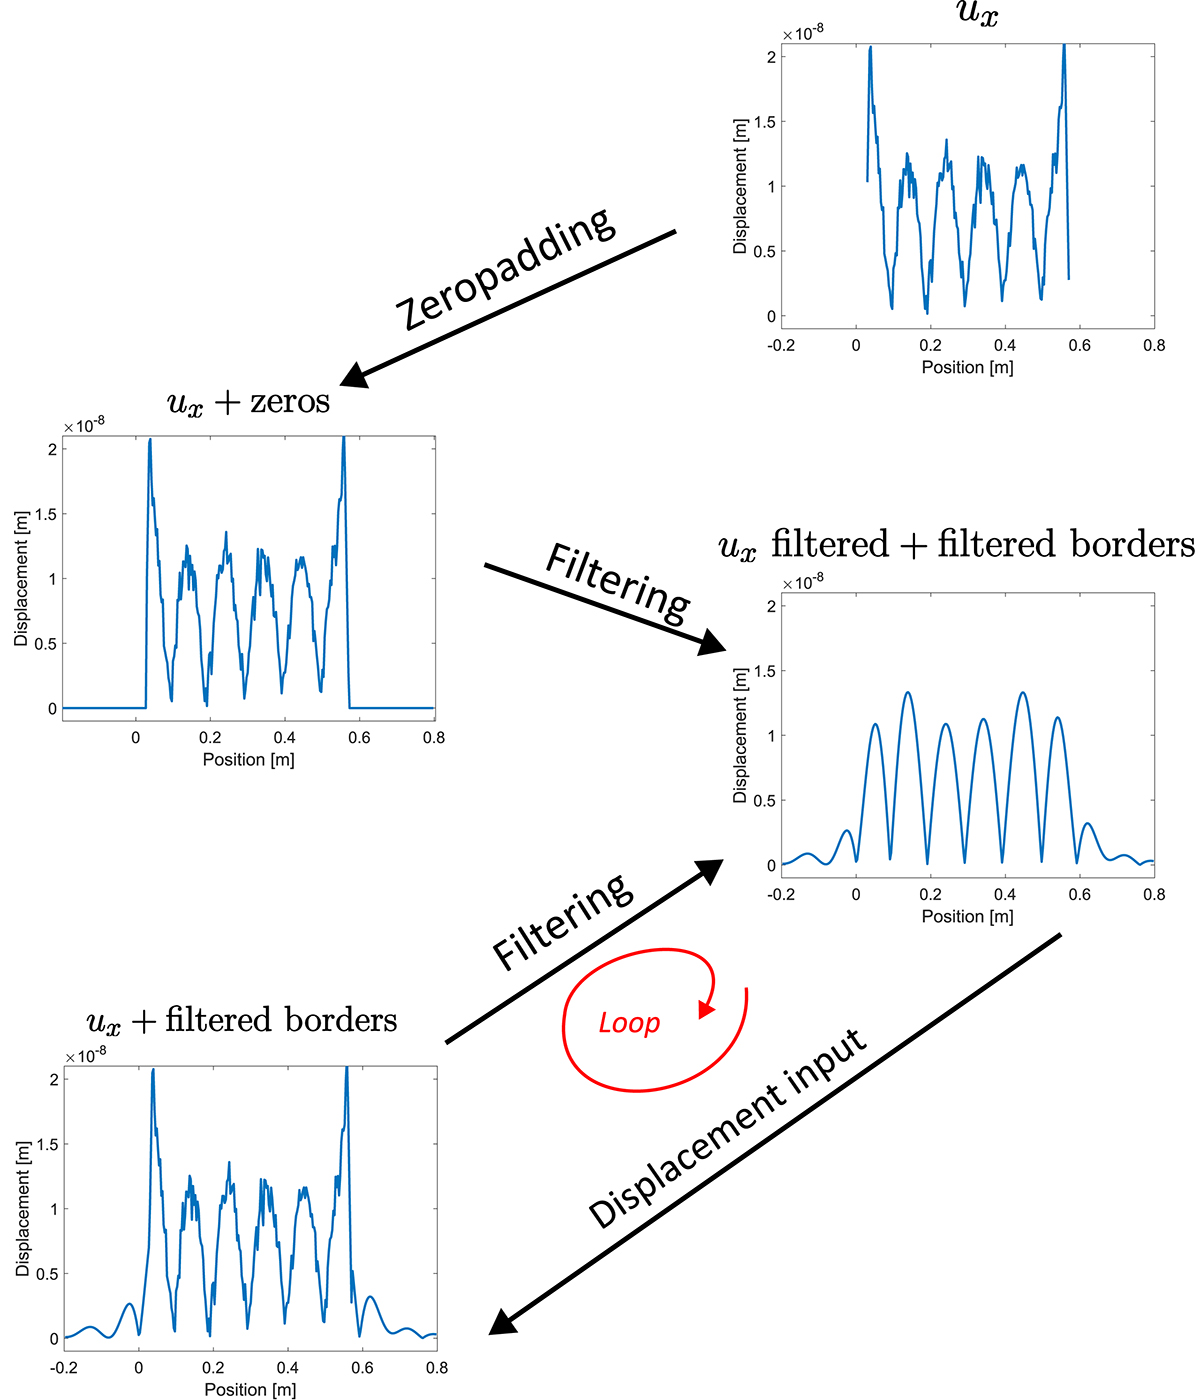
Filtering flowchart with border-padding. Border-padding is achieved using zero-padding and a succession of filterings. To achieve this, the measured displacement field is re-injected at each cycle without modifying the edges, in order to gradually obtain border-padding solely from the measured data.
Current usage metrics show cumulative count of Article Views (full-text article views including HTML views, PDF and ePub downloads, according to the available data) and Abstracts Views on Vision4Press platform.
Data correspond to usage on the plateform after 2015. The current usage metrics is available 48-96 hours after online publication and is updated daily on week days.
Initial download of the metrics may take a while.