Figure 2
Download original image
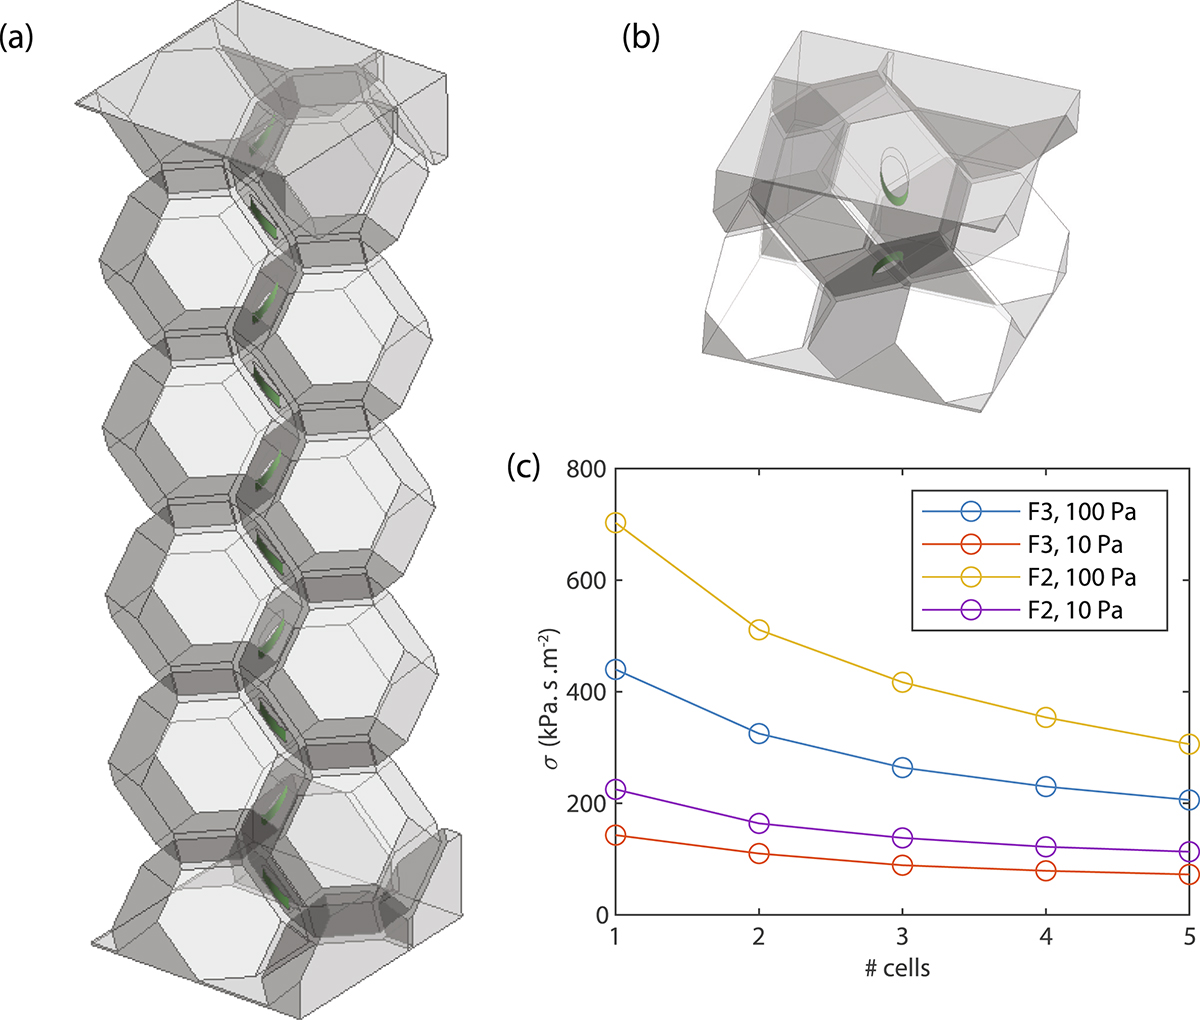
Geometry of two different RVEs for the flow simulation with 5 unit cells (a) and 1 unit cell (b) through the thickness. The perforations highlighted in green shows the connection between an entire Kelvin cell and two parts of neighboring cells. The flow resistivity values (c) show a convergence from 5 unit cells, for two different materials and two different inlet pressures.
Current usage metrics show cumulative count of Article Views (full-text article views including HTML views, PDF and ePub downloads, according to the available data) and Abstracts Views on Vision4Press platform.
Data correspond to usage on the plateform after 2015. The current usage metrics is available 48-96 hours after online publication and is updated daily on week days.
Initial download of the metrics may take a while.