Open Access
Figure 3
Download original image
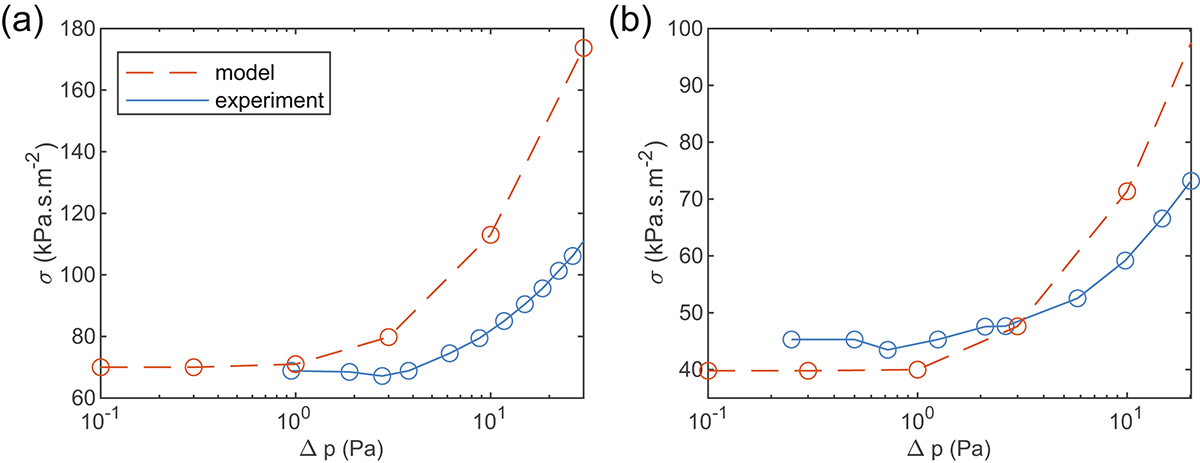
Modeled (red dashed line) and experimental (blue line) flow resistivity values for material F2 (a) and F3 (b). The RVE model captures the low-pressure value but overestimates the nonlinear increase of σ.
Current usage metrics show cumulative count of Article Views (full-text article views including HTML views, PDF and ePub downloads, according to the available data) and Abstracts Views on Vision4Press platform.
Data correspond to usage on the plateform after 2015. The current usage metrics is available 48-96 hours after online publication and is updated daily on week days.
Initial download of the metrics may take a while.