Figure 5
Download original image
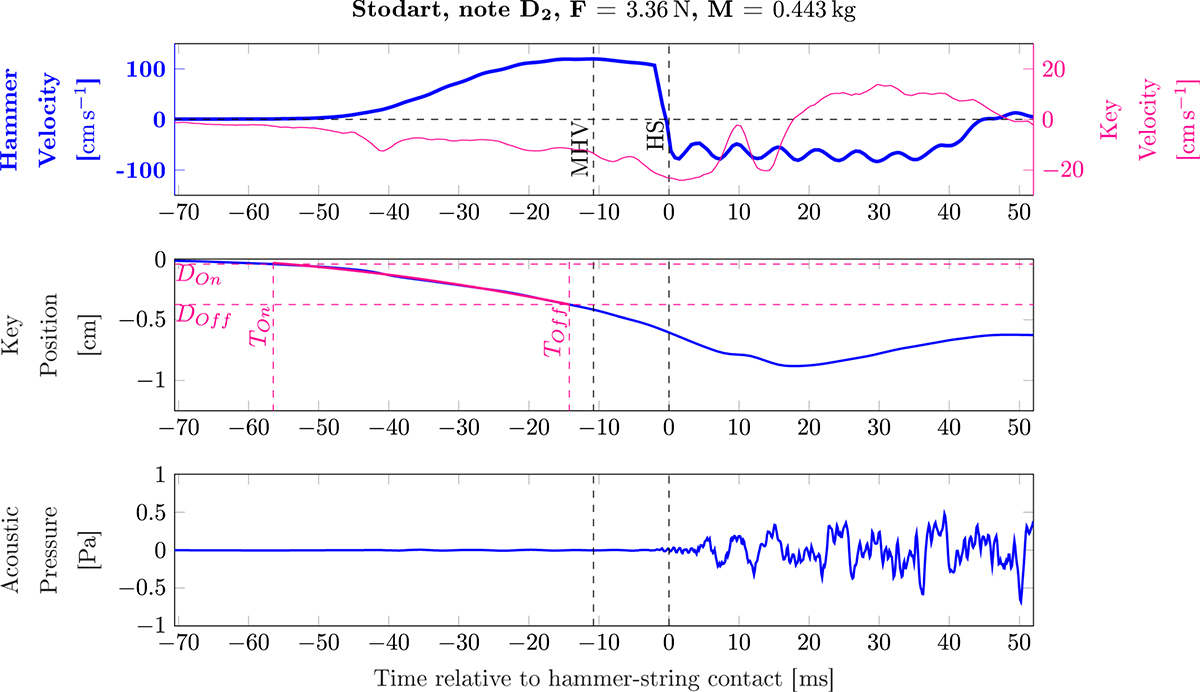
Estimated signals for a key depression with F = 3.36 N and M = 0.443 kg on the Stodart’s key playing D2. From top to bottom: hammer head and key front velocities; key front displacement; acoustic pressure of the produced sound. Vertical lines in the figure indicate the onset time of hammer free rotation (MHV), estimated as the local maximum of hammer velocity, and a representative time of the hammer-string impact phase (HS), estimated as the maximum of the raw hammer acceleration signal (not displayed). The parabolic regression on the displacement signal in the interval (TOn, TOff), corresponding to displacements (DOn, DOff), is superimposed on the key displacement signal.
Current usage metrics show cumulative count of Article Views (full-text article views including HTML views, PDF and ePub downloads, according to the available data) and Abstracts Views on Vision4Press platform.
Data correspond to usage on the plateform after 2015. The current usage metrics is available 48-96 hours after online publication and is updated daily on week days.
Initial download of the metrics may take a while.