Figure 8
Download original image
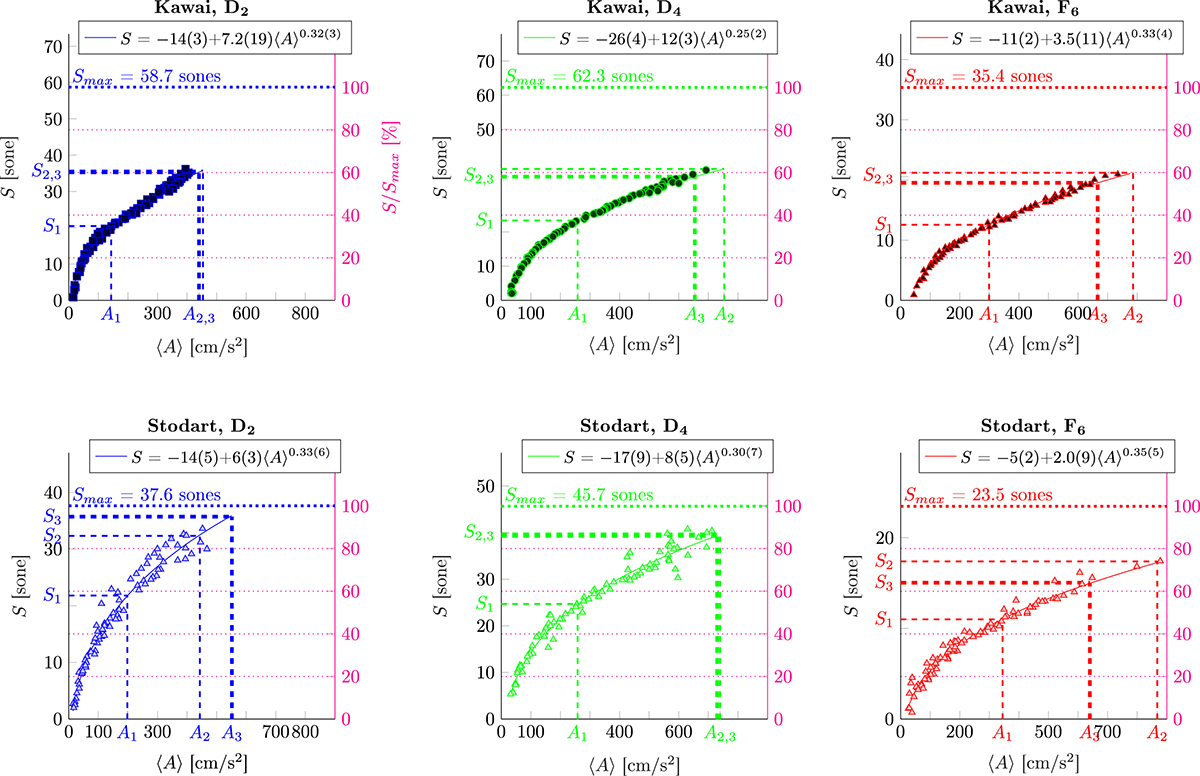
Estimated loudness for the acoustic pressure signals, S, as a function of the average key acceleration 〈A〉. The data are obtained from all considered excitations using the mechanical arm (see Tab. 1). The maximums of S, Smax, produced on each key by the first author (who is also a pianist) with a pressed touch are shown. S is reported in sones on the left-side y-axis and as percentage over Smax on the right-side y-axis. The data have been approximated by a robust non-linear regression with a power law of the form ![]() , where 〈A〉 is expressed in cm/s2. The coefficients of the estimation are shown in figure. The standard deviation of the estimates is indicated in parentheses as uncertainty on the least significant digit.
, where 〈A〉 is expressed in cm/s2. The coefficients of the estimation are shown in figure. The standard deviation of the estimates is indicated in parentheses as uncertainty on the least significant digit.
Current usage metrics show cumulative count of Article Views (full-text article views including HTML views, PDF and ePub downloads, according to the available data) and Abstracts Views on Vision4Press platform.
Data correspond to usage on the plateform after 2015. The current usage metrics is available 48-96 hours after online publication and is updated daily on week days.
Initial download of the metrics may take a while.