Figure 7
Download original image
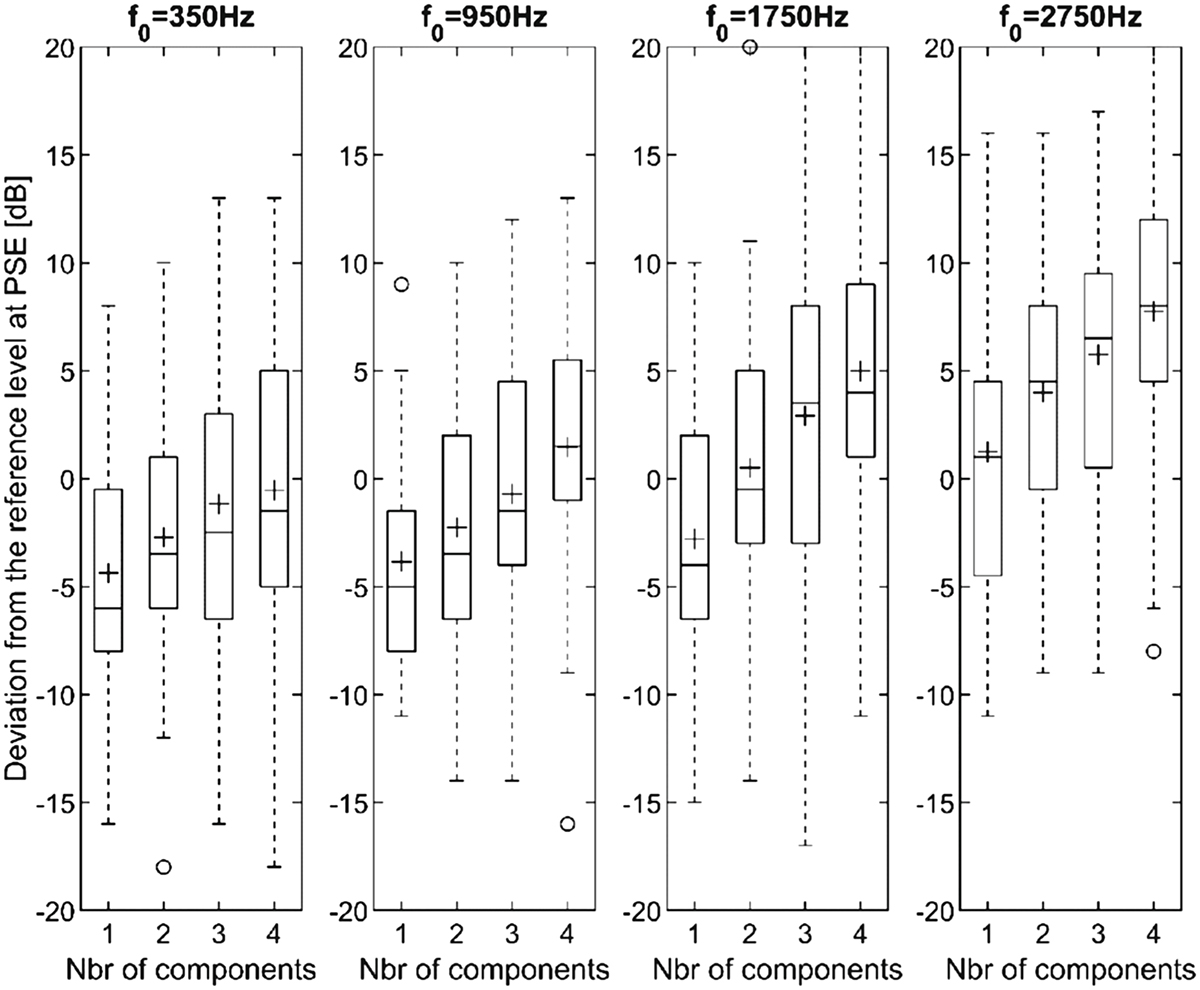
Box plots of PSE comparing adjustable noise to fixed tonal sound. The stronger the tonal sound is perceived the higher will the deviation be set. The bottom and top edges of the boxes indicate the 25th and 75th percentiles, respectively. The whiskers extend to the most extreme data points, outliers excluded. Rings indicate outliers. The cross indicates the average value, and the line indicates the median.
Current usage metrics show cumulative count of Article Views (full-text article views including HTML views, PDF and ePub downloads, according to the available data) and Abstracts Views on Vision4Press platform.
Data correspond to usage on the plateform after 2015. The current usage metrics is available 48-96 hours after online publication and is updated daily on week days.
Initial download of the metrics may take a while.