| Issue |
Acta Acust.
Volume 9, 2025
|
|
|---|---|---|
| Article Number | 16 | |
| Number of page(s) | 15 | |
| Section | Aeroacoustics | |
| DOI | https://doi.org/10.1051/aacus/2024085 | |
| Published online | 20 February 2025 | |
Scientific Article
Development and commissioning of an aeroacoustic test bench for the investigation of single and coaxial propeller noise
1
von Karman Institute for Fluid Dynamics, 1640 Rhode-St-Genèse, Belgium
2
Université Libre de Bruxelles, 1050 Bruxelles, Belgium
* Corresponding author: This email address is being protected from spambots. You need JavaScript enabled to view it.
Received:
3
June
2024
Accepted:
18
November
2024
Abstract
This paper describes the design and commissioning of an aeroacoustic test rig for the study of single and coaxial propeller propulsive systems. The size of the propellers matches typical drone applications. The experimental setup, designed and commissioned at the ALCOVES anechoic laboratory of von Karman Institute for Fluid Dynamics, is equipped with aerodynamic sensors for performance analysis and is surrounded by a microphone antenna for the characterization of the noise level and directivity. Thefacility permits varying different parameters such as the longitudinal distance between the rotor planes, and the rotational speed/direction of each propeller. Requirements for the qualification of the test room consist of low-level background noise and minimized turbulence ingestion noise. Two experimental databases have been constituted and are joined to the present paper: (i) for the DJI 9450 two-bladed propeller, verified against data from the literature, and (ii) for single and coaxial contra-rotating Mejzlik two-bladed propellers. The proposed benchmark data will support the validation of low- and high-fidelity numerical methods.
Key words: Propeller noise / Contrarotating propeller / Drone noise / Propeller aerodynamic
© The Author(s), Published by EDP Sciences, 2025
 This is an Open Access article distributed under the terms of the Creative Commons Attribution License (https://creativecommons.org/licenses/by/4.0), which permits unrestricted use, distribution, and reproduction in any medium, provided the original work is properly cited.
1 Introduction
Coaxial propellers on drones and Urban Air Mobility (UAM) vehicles minimize the propeller area per thrust output and provide redundancy for componentsfailure [1, 2]. Nevertheless, their high level of acoustic emissions and peculiar noise signature are likely to hinder their societal acceptance [3]. Low-noise drone and UAM technologies will undoubtedly be needed, for which a prerequisite is to have documented aeroacoustic characterization. Therefore, detailed laboratory experiments are required to cross-validate prediction models, and to generate extensive databases permitting the tuning of surrogate models for optimization purposes [4].
A coaxial propeller test rig should enable the control of the key parameters affecting aero-propulsive performance and noise emissions. The longitudinal distance between the rotor planes is one of those parameters [5]. A decrease in the overall sound pressure level (OASPL) was observed with increasing distance between propellers, mostly due to a decrease in tonal noise rather than broadband noise. The overall thrust, instead, did not vary with spacing. The authors suggested a possible change in the dominant noise generation mechanisms as a possible consequence of varying distances. Chaitanya et al. [6] indicated that potential field interactions are responsible for noise generation if the distance between propellers is shorter than z/D = 0.25, with D the diameter of the propellers.
Drones continuously adjust their rotational speed during maneuvers, suggesting that the variation of RPMrepresents a relevant parameter to examine [7, 8]. Nevertheless, this aspect remains scarcely explored. In the current study, the opportunity to control the longitudinal distance and the RPM has been the major driver at the early stage concept of the test rig.
The design of the test rig is based on existing literature studies outcomes. A conventional coaxial propeller test setup can be composed of two overlapping propellers placed on distinct test stands without axis interference (as proposed in Ref. [9]). The latter might introduce extra noise sources because of the presence of additional frames, which have the potential to divert the propeller’s slipstream [10]. Alternatively, the rotors can be mounted along the same axis [11–14]. This design results in challenges when attempting to adjust the distance between elements, yet it allows minimal installation effects that facilitate the decomposition and analysis of the noise mechanisms. The design of the test rig presented hereby aims at mitigating external noise sources often linked to test bench installations, such as interactions with support structures and similar factors, to better isolate the propeller self-noise.
The signature of the propeller aerodynamic noise consists of broadband and periodic components [15]. The broadband noise is mainly produced by vortices shed but the trailing edge or the tip of the blades and interacting with the blade itself. The periodic component produces tones at multiples of the blade passing frequency and they are related to the forces on the blades. In addition, blade-vortex interactions (BVI) phenomena could also occur. They contribute to tonal noise generation because of the pressure fluctuations on a blade induced by the tip vortices shed by a preceding blade. In experimental conditions, the propeller self-noise is susceptible to external factors, whose sensitivity varies depending on the specific test conditions. Therefore, the preliminary set of measurements is focused on the quantification of the background noise in the anechoic room, the noise emitted by the cooling system, and the motors alone. A comparison with the isolated propeller is provided.
Another key aspect when investigating propeller noise in a confined environment is the risk of wake re-circulation. The occurrence of recirculating flow patterns within the confined test section environment was shown to impact the rotor aerodynamics [16]. Rotor acoustics can be influenced by the potential for large flow structures to be re-ingested during hover tests as well [17]. Recent experimental campaigns have specifically focused on investigating the influence of flow re-circulation on the aeroacoustics of hovering propellers within anechoic chambers [18, 19]. Their findings revealed distinct characteristics compared to those of similar propellers operating in clean inflow conditions as both tonal and broadband noise components increased significantly when the propeller ingested recirculated flow. However, flow re-circulation effects are not always observed as there is a strong dependence on the test conditions [6, 20]. The experimental setup presented in this paper has been designed to accommodate various propeller types after minor adjustments, enhancing the versatility of the testing facility. Hence, the DJI 9450, a well-documented propeller in terms of noise and performance, has been selected for validation with existing literature [19, 21]. Finally, the main objectives are:
-
to present an experimental setup designed to minimize external disturbances;
-
to establish a new experimental database related to a Mejzlik 13 × 4.2 propeller.
The structure of this paper is as follows: Section 2 provides a description of the experimental facility, including the test rig, components, and the sensors used for measurements. In Section 2.6, the methodology and techniques employed for data analysis are reported. Section 3 is divided into the analysis of preliminary results for commissioning, and the Mejzlik 2-blade propeller database is discussed. A final summary of the paper is given in Section 4.
2 Presentation of the test rig
The multi-rotor system has been designed, assembled, and manufactured at the von Karman Institute for Fluid Dynamics, to enable the aeroacoustic investigation of coaxial propeller systems while minimizing the extraneous noise sources associated with the test bench itself, and the installation effects such as interactions with supporting struts.
2.1 Anechoic laboratory – ALCOVES
The test mockup is located in the ALCOVES anechoic laboratory, shown from a top view in Figure 1. The facility consists of two rooms, a main test room, and a discharge room, separated by a wall partition with a 1 m × 1 m opening (initially designed to host cooling fan systems). In the experiments reported below, the propeller is located in the main acoustic test room (Fig. 2), which is the largest one upstream of the wall partition. The size of the main room is 2.5 m × 4.5 m. This room has been commissioned according to the ISO:3745 standard [22], demonstrating free-field behavior down to 150 Hz for both broadband and tonal noise sources [23].
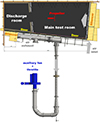 |
Figure 1 Alcoves facility scheme. |
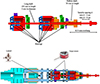 |
Figure 2 Fairing, cooling hose, supporting stand, and microphone setup in the anechoic room ALCOVES. |
The room includes an air inlet (on the right in Fig. 1) and an air outlet from the discharge room, leading to an auxiliary fan that can be used to drive the flow through the facility. In this work, the auxiliary fan was not operated. The propeller axis is aligned with the opening in the wall partition, to direct the propeller wake towards the discharge room. The propeller plane is located at a distance of 1.80 m from the wall partition opening.
2.2 Instrumented coaxial rotor system
The sketch of the setup and its main dimensions are illustrated in Figure 3. The mockup comprises two independent propeller systems: Propeller 1 indicates the front propeller and Propeller 2 the rear one. The front propeller spins clockwise (seen from upstream) and the rear propeller spins counter-clockwise.
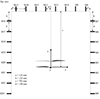 |
Figure 3 Top: layout of the motors, shafts, and bearings. Bottom: integration on the sliding frame (blue) connected to the fixed frame (cyan) through low-friction ball sleeves. |
The motors are T-Motors AT2814 Long Shaft 550 KV. Their maximum rotation speed is 10 000 RPM. The motors are controlled using Scorpion Tribunus II 12-80A ESC SBEC controllers. The motors have a hollow axis, allowing the front propeller axis to pass through thehollow shaft of the back propeller. The alignment and support are provided by twelve bearings. This arrangement allows independent settings of the RPM and sense of rotation of the two propellers.
The test stand is equipped with sensors to measure the aerodynamic performance of the system, shown in Figure 3. The rotational speed is measured using two tachometers based on reflective sensors (VISHAY TCRT500), an infrared emitter, and a phototransistor. Two encoders CUI Devices AMT 22 type detect the propellers’ phase angle. The encoders ensure an accuracy of 0.2° up to 8000 RPM. They allow the control of the relative clocking between the front and rear propellers.
The overall thrust of the system is measured using a Futek LCM100 (FSH03828) load cell, placed between the rigid structure and a sliding frame containing the propeller systems. The sliding frame is guided with two low friction ball sleeves (Fig. 3). The torque delivered by each motor is measured by two Futek QTA141 micro reaction torque sensors that connect the motors to the sliding frame. The motors and load sensors are fitted with thermocouples to monitor the safe operation of the rig and permit a temperature correction of the thrust and torque readings.
The equipment is housed inside a fairing designed to provide a clean axisymmetric geometry for numerical simulations, to minimize the interactions between the slipstream of the propellers and the different systems shown above, and to attenuate the noise emitted by the bearings. The fairing has been 3D-printed in Rigid 4000 Resin and is attached to the fixed frame (colored in cyan in Fig. 3). The load cell measurement is thus not affected by the pressure and viscous stresses induced by the propeller slipstream on the fairing outer wall.
The heat emitted by the motors, which would threaten the integrity of the system and affect the sensors, is removed by injecting cold air onto the electric motors, load cells, and torque sensors. The air mostly leaves the fairing enclosure through the back, with a small fraction of the air leaving through the annular gap between the shaft and the front fairing opening. It has been verified that it does not perturb the propeller flow. However, the injection of air was found to offset the reading of the load cell. This offset must be included when performing the balance calibration (Appendix A.1.2).
2.3 Microphone arrays
The position of the microphones is defined with respect to the center of a Cartesian coordinate system with the origin in the center of the rear propeller(Propeller 2) disk. Here, the z-axis was oriented upstream along the rotor axis. The y-axis is pointing down vertically, and the x-axis completes the system based on the right-hand rule (see Fig. 4). The measurements with the microphone antenna were carried out within a range of ±400 mm along the y-axis, with the motorized system moving at intervals of 100 mm.
 |
Figure 4 Top view with dimensions of the microphone array scheme composed of 24 sensors used in ALCOVES. The origin of the reference system is set in the center of the rear propeller disk. |
The initial characterization has been performed using three microphones, two located on the propeller plane and one in front at an angle of 10.6° (see Fig 5blueb). The distances of the microphones with respect to the reference are specified in Figures 5bluea and 5blueb.
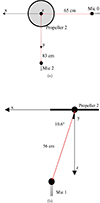 |
Figure 5 Microphone setup in ALCOVES. |
In the second phase, three linear microphone arrays mounted on a motorized traversing system allow the acoustic field to be measured in three planes surrounding the propeller (Fig. 4). A total of 216 measurement points are used to calculate the noise maps.
The acoustic measurements were performed using G.R.A.S. 40PL condenser microphones, as shown in Figure 2.
2.4 Propellers
The propellers used for the collection of the database are the DJI 9450 and Mejzlik 13′′ × 4.2 2-blades counter-clockwise and clockwise models, shown in Figure 6.
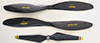 |
Figure 6 From the top: (i) Mejzlik 13′′ × 4.2 propeller counter-clockwise used at rear position, (ii) Mejzlik 13′′ × 4.2 clockwise propeller used at front position, and (iii) DJI 9450 propeller. |
The former is an off-the-shelf model designed for the DJI Phantom 2 and 3 commercial drones. The DJI 9450 is used as a reference for cross-validation as well-documented in literature: references [21, 24] report the DJI 9450 aerodynamic performance, whilst the acoustic data are provided in reference [19].
2.5 Test matrix
The test matrix was divided into two stages: the commissioning of the new facility, and the constitution of a novel database for contra-rotating propellers. The commissioning consisted of the following verification steps:
-
background noise vs. single propeller noise;
-
effect of potential recirculating turbulence in the anechoic room on the noise levels;
-
cross-validation of the noise and aerodynamic performance of the DJI 9450 two-bladed propeller with the literature.
The background noise includes components associated with the anechoic room environment, with the electric motors, and with the cooling airflow. The motor noise has been measured from 4000 to 7000 RPM.
The possible wake re-circulation noise was assessed with Mejzlik 13 × 4.2 two-bladed, as well as the DJI 9450 propeller across a range of 4000 to 7000 RPM. Finally, the DJI 9450 single propeller was set at 5250 RPM to validate against reference [19].
The new database, including the aerodynamic and acoustics characterization of single and coaxial Mejzlik two-bladed propellers, has been recorded and published on the open-source ZENODO platform [25]. Each measurement entailed a systematic increment of 100 RPM, lasting for a duration of 30 s according to the statistical convergence of the signal. The configurations are shown in Tables 1 and 2.
Motor and single propellers test configurations.
Coaxial propellers test configurations.
2.6 Data analysis
The aerodynamic thrust T [N] and torque Q [N m] are measured using the loadcell and torque sensors described in Section 2.2, and quantified after the calibration procedure described in Appendices A.1.2–A.2. The non-dimensional thrust and power coefficients, C T and C P respectively, related to the revolutions per second, n, are defined through equations (1) and (2):
 (1)
(1)
 (2)
(2)
where ρ [kg m−3] is the air density, n is the rotational speed expressed in [rev s−1], P is the propeller mechanical power given by ΩQ [W], with Ω the rotational speed expressed in rad s−1, Q the torque in N m and D the propeller diameter in m.
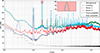 |
Figure 7 SPL of anechoic room, cooling system, motors alone and isolated Mejzlik 2-blades propellers at 6000 RPM measured at Mic A. |
The data acquisition system of the GRAS Microphones consisted of a cDAQ-9178 chassis equipped with six NI-9234 modules. The raw signals have been acquired using LabView software over an acquisition time of 30 s. A piston phone type 4231 B&K was used to convert the GRAS-type microphone’s Voltage acquisition to pressure units Pascal using an acoustic wave emitted at a frequency of 1 KHz corresponding to 94 dB.
According to [26], the Sound Pressure Level (SPL) (dB) is estimated as follows:
 (3)
(3)
where the PSD [dB/Hz] indicates the Power Spectral Density of the signal, Δf [Hz] is the frequency resolution of the signal, and p ref = 20 × 10−6 [Pa] is the reference pressure. The PSD was computed by means of Welch’s method using the following parameters:
-
sampling frequency fs 51 200 Hz,
-
hanning window with 213 number of segments,
-
212 number of points to overlap between segments,
-
and 214 number of data points used in each Discrete Fourier Transform (DFT).
Additionally, the noise spectrogram is computed to analyze the frequency content of signals over time using the aforementioned parameters.
The SPL at a distance r 2, SPL2, is calculated as
 (4)
(4)
where SPL1 denotes the measured sound pressure level at the distance r 1 [27].
3 Results
3.1 Background noise levels
Figure 7 shows the SPL measured at Mic A, indicated in Figure 5bluea, of anechoic room background, cooling system, motors alone, and isolated Mejzlik 2-blades propellers operating at 6000 RPM. In the legend, Motor 1 and Motor 2 refer to the motors driving the front and rear propellers, respectively. The background noise of the room itself, represented by the dash-dot black line, is well below all the other measurements over the range of frequencies for which the room is practically anechoic (f > 100 Hz). The cooling system defines the background broadband noise for frequencies above 300 Hz. The motors add a tonal background noise to the cooling broadband levels. The first Blade Passing Frequency (BPF) of 200 Hz is marked with a black line in Figure 7. The peaks observed peaks at the shaft frequency of 100 Hz are presumably linked to slight asymmetries or misalignment of some components shown in Figure 3. Overall, motor noise does not significantly influence the noise generated by the propellers alone. At the first BPF, the difference between the noise generated by the motors and one propeller is more than 30 dB. At the first BPF, the difference between the front and rear propellers is 1 dB, as shown in the region highlighted in red in Figure 7.
3.2 Recirculating turbulence noise levels
Previous works showed that in a closed room, the ingestion by the propeller of its recirculating turbulence is likely to increase its noise emissions [19]. Acoustic measurements were conducted for different operating points of a single Mejzlik 2-blades propeller (see Tab. 1) in order to verify this potential issue. A representative spectrogram is shown in Figure 8. The measurements were taken at Mic A over a 30 s interval. The initial 10 s of the spectrogram captures the ramp-up phase of the test rig, during which the propeller speed increases from an initial RPM to a peak value before the controller stabilizes it at the desired RPM. The tonal peaks corresponding to the BPFs are represented by the horizontal lines. The spectrum does not reveal any rise in either tonal or broadband noise levels over time. Given the small size of the room, one would have expected to see a transient effect of the recirculating flow. The spectrograms seem to indicate otherwise. This may be either attributed to the fact that the propeller wake turbulence gets somehow “trapped” in the downstream room, or that the time needed to establish the recirculation is comparable to the time it takes for the RPM to stabilize, in which case discriminating both transient effects becomes difficult. Further investigation will be needed to elucidate this question.
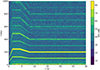 |
Figure 8 SPL spectrogram of isolated Mejzlik 2-blades propellers at 6000 RPM measured at Mic A. |
3.3 Validation with existing literature – DJI 9450 propeller
The measurements with the DJI 9450 propeller were performed using the short shaft of the test rig (Fig. 3). The CT and CP were measured for rotation speeds between 4000 and 7000 RPM. The air density was equal to ρ = 1.2 kg m−3 during those tests. The results are shown in Figure 9 alongside existing data from the literature.
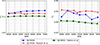 |
Figure 9 Thrust and power coefficients, C T and C p , of DJI 9450 propeller measured in ALCOVES laboratory, VKI. The reference data for the DJI 9450 are extracted from the literature [21, 24] (U ∞ = 0). |
The thrust coefficient CT obtained for the DJI 9450 propeller rises from 0.12 to 0.13 between 4000 and 7000 RPM, standing slightly above the values reported in references [21, 24]. The power coefficient CP falls between the published data.
The noise levels measured in ALCOVES at 5250 RPM are compared in Figure 10 with the data reported in reference [19]. Equation (4) was used to scale the SPL at a reference distance of 1 m. Figure 10 presents the SPL comparison, revealing that the first tonal peak is in excellent agreement with reference [19]. A fair match is also found for the higher BPFs.
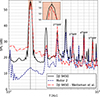 |
Figure 10 Noise measured with DJI 9450 at 5250 RPM, scaled with distance, and compared to existing literature [19]. |
3.4 Aerodynamic performances for the Mejzlik 2-blade propeller
Having validated the facility and measurement chain for the DJI 9450 propeller, a novel database has been developed for the Mejzlik 13 × 4.2 propeller, in both isolated and counter-rotating coaxial configurations. In the latter case, the axial spacing was varied from 0.02 m to 0.04 m. The aerodynamic performance data are shown in Figure 11.
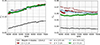 |
Figure 11 Thrust and power coefficients, C T and C p , of single and coaxial contra-rotating Mejzlik 13 × 4.2 propeller configurations. For the coaxial cases, the longitudinal separation between the two propeller planes is varied from d = 2 to 4 cm. |
In contrast with the DJI 9450 propeller, the Mejzlik 13 × 4.2 propeller exhibits a significant variation of its thrust coefficient over the investigated range of rotation speeds, increasing nearly monotonically from 0.063 to 0.088. Low Reynolds effects could explain this behaviour, for example if a spanwise portion of the blade would be stalled, with a spanwise extent that would decrease with increasing rotation speed. It should be noted that the surface finish of the Mejzlik carbon-epoxy propeller is much smoother than that of the DJI 9450. More investigations would be needed to clarify this behaviour, but this makes a priori the Mejzlik 13 × 4.2 propeller an interesting case for the investigation of transitional effects.
The thrust coefficient of the coaxial contra-rotating propeller is expectedly larger than that of the single propeller, though not quite doubled. This can be explained by the fact that the downstream propeller sees an increased advance ratio due to the upstream propeller stream, resulting in a reduced thrust. The analysis reveals that no major difference is observed in the thrust coefficients for varying distances.
The power coefficient of the single Mejzlik propeller remains nearly constant over most of the frequency range. And this time, varying the spacing in the coaxial configuration seems to have a non-negligible effect. The results obtained for d = 3 cm and 4 cm exhibit indeed substantial deviations from the other curves. The absence of a monotonic trend of the power coefficient as a function of the separation complicates however the interpretation of the graph, which would deserve further investigations to better understand the observations.
3.5 Acoustic characterization of the Mejzlik 13 × 4.2 propeller
This section presents the acoustic characterization of single (counterclockwise type) and contra-rotatingMejzlik propellers within the experimental database outcomes [25]. The analysis will focus on the tonal noise emitted by the propellers as it is usually the main contribution to the overall noise levels. Section 3.5.1 presents the noise maps for the first BPF acquired with the microphone antenna, while Sections 3.5.2 and 3.5.3 investigate the effect of varying RPM and varying distances between the two propellers.
3.5.1 Noise maps
Figures 12 and 13 depict the SPL at the first BPF peak measured with the squared microphone antenna (see Sect. 2.3) with single and contra-rotating Mejzlik 2-blades propeller operating at 6000 RPM, respectively. The single propeller was rotating counter-clockwise. Moreover, the distance between the front and rear propellers in coaxial configuration was set to d = 3 cm. The SPL is shown for the three planes scanned by the antenna (see Fig. 4). In Figures 12 and 13, the propeller disk is represented in black. In total, 216 measurements were taken across the grid for the test cases. The first tone is mainly caused by the steady loading noise on the propeller. Higher noise levels are measured closer to the rotor plane, as predicted by theory [15]. This phenomenon is noted in both single and contra-rotating cases (Figs. 12 and 13). Similarly for single and coaxial propellers, the noise maps show a variation of about 10 dB between the radiation observed at the upstream section and the propeller plane where higher levels of noise are measured. In Figure 13, the noise radiation of coaxial propellers appears to be distributed uniformly across the upstream plane. Overall, the levels of radiated noise increase by about 3 dB in the region of the propeller plane with a coaxial configuration with respect to the single propeller.
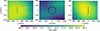 |
Figure 12 Map of the SPL at the 1st BPF measured with single Mejzlik 2-blades propeller at 6000 RPM (U ∞ = 0). The propeller disk side and front view are outlined in black. |
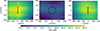 |
Figure 13 Map of the SPL at the 1st BPF measured with contra-rotating Mejzlik 2-blades propeller at 6000 RPM (d = 3 cm, U ∞ = 0). The propeller disk side and front view are outlined in black. |
3.5.2 Effect of varying RPM
The tonal peaks obtained from measurements with a single Mejzlik propeller for different RPM are reported in Figure 14. The measurements are shown at three distinct positions, Mic A, Mic C, and Mic B (see Fig. 5), represented by red, blue, and green curves, respectively. The 1st tonal peak extracted for a single propeller is shown in Figure 14bluea. The observed SPL monotonically rises over RPM from 63.5 dB to 76.3 dB, and from 58.3 dB to 75.2 dB measured at Mic A and Mic B, respectively. The variation of the first tones versus RPM measured at Mic C presents an oscillatory trend, yet the overlap of the three curves is clear. In Figure 14blueb, the increment of the second tonal peaks over the RPM across all the test cases is also monotonic, except for the first three RPM measured at Mic A. The third and fourth tones, shown in Figures 14bluec and 14blued follow the same trend, confirming that the most significant tone is the first one. However, a sudden increase and decrease in the noise is observed in the 3rd tone for Mic B between 4200 and 4600 RPM. This deviation from a monotonic increase may be linked to low-Reynolds transitional effects. At higher RPM the boundary layer is more likely to be fully turbulent. In general, Figure 14 suggests that there are no critical flow distortion events under the specified operating settings. The analysis of tones carried out for the contra-rotating configuration is reported in Figure 15. Specifically, this analysis focuses on the contra-rotating configuration at a separation distance of 4 cm. The difference with respect to a single propeller is evident by looking at the 1st tones over RPM, shown in Figure 15bluea. As for the single propeller, the three curves represent Mic A, B, and C. It is clear that the trend of the tones emitted by a contra-rotating is not monotonic with the increase of RPM; instead, fluctuations are observed with the systematic increase of RPM. Starting from 4200 RPM, the trends of the tones measured at Mic A and Mic B (on the propeller plane) are similar, with an approximate 4 dB difference. The tones recorded at Mic C also display a fluctuating trend, remaining within the emitted range of 52 dB to 79 dB. By looking at higher BPF harmonics in Figures 15blueb–15blued, it is clearly illustrated that the second tone measured at Mic C is dominant (as observed for the single propeller case in Fig. 14), and it increases with a linear trend over the RPM range. On the contrary, the higher harmonic tones measured with microphones located on the rear propeller plane decrease by ≈10 dB with respect to the firsttone.
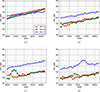 |
Figure 14 Tonal noise of 1st, 2nd, 3rd, and 4th BPF harmonics for single Mejzlik 2-blades propeller operating measured at Mic A, B and C (6000 RPM, U∞ = 0). (a) 1st BPF. (b) 2nd BPF. (c) 3rd BPF. (d) 4th BPF. |
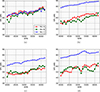 |
Figure 15 Tonal noise of 1st, 2nd, 3rd, and 4th BPF harmonics for contra-rotating Mejzlik 2-blades propeller measured at Mic A, B and C (6000 RPM, d = 4 cm, U ∞ = 0). (a) 1st BPF. (b) 2nd BPF. (c) 3rd BPF. (d) 4th BPF. |
Two main conclusions can be drawn from Figures 14 and 15:
-
(a)
The prevalence at high BPFs harmonics of the tonal noise measured at Mic C indicates that further analysis of directivity noise maps is necessary, especially for specific operating points typical in drone applications. In a contra-rotating configuration, the increased loading on the propeller blade is likely to be responsible for such an effect, along with increased motor noise.
-
(b)
The different trend of 1st tones over RPM shown in Figures 14bluea and 15bluea implies that the varying loading expected in a coaxial configuration has a relevant effect with varying the RPM. The fluctuating behavior with a contra-rotating propeller suggests specific RPM ranges where reduced noise levels occur. Considering that the first tone is indicative of steady loading, this finding might suggest that lower noise is associated with conditions of decreased thrust, despite the results provided in Section 3.4 illustrating an increase in load with RPM.
3.5.3 Effect of varying distance
The examination of coaxial contra-rotating propeller configuration includes the assessment of the impact of varying spacing on tonal noise, as shown in Figure 16. The 1st tones measured at Mic A at the distances reported in Table 2 over RPM are reported as reference. The trends reveal that the fluctuating behavior at increased RPM becomes relevant with increased spacing. However, no critical variation of SPL is measured in this range of distances. In particular, the sound levels vary from 60 to 65 dB within the 4000 to 5000 RPM range, up to 70 dB to 80 dB between 5500 and 6000 RPM. Similar findings were found for Mic B and C.
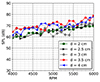 |
Figure 16 1st tones measured with contra-rotating Mejzlik 2-blades propeller at Mic A at a varying distance and RPM (U ∞ = 0). |
4 Discussion
The scope of this work is to present a propeller test rig designed for the investigation of the aerodynamic performance and noise emissions of single and coaxial configurations. The procedure to assess the suitability of the facility and setup was based on the differentiation of background noise sources. The motors alone and air cooling radiate lower levels than the noise produced by the single propeller itself. Furthermore, the facility does not experience any significant adverse effects from turbulencere-circulating noise. Finally, aerodynamic performances and Sound Pressure Levels are provided for the DJI 9450 propeller and used as a reference for cross-validation checks with existing literature. The experimental database documented in this work comprises aeroacoustic data for single and contra-rotating Mejzlik two-bladed propellers at varying RPM, and longitudinal distance.
The analysis of the experimental tests reveals the following:
-
Aerodynamic parameters, including thrust and power coefficients (CT and CP), range from 0.05 to 0.15 and 0.05 to 0.07 respectively, across an RPM range of 4000 to 7000, in both single and coaxial configurations. The thrust coefficient CT in contra-rotating conditions is unaffected by variations in the distances between the front and rear propellers within a range of up to 4 cm allowed by the test rig. At varying distances, the power coefficient CP remains constant across the entire RPM range.
-
The square antenna equipped with 24 microphones allows simultaneous sound recording from multiple locations. Examination of the first tonal peak mapped for both single and coaxial propeller configurations shows the expected sound directivity. Specifically, the noise levels at the propeller level are approximately 75 dB for single propellers and approximately 85 dB for contra-rotating configurations.
By looking at the effects of varying RPM and distance, the major outcomes are:
-
Single Mejzlik 13 × 4.2 blades in hover: the first tonal peak SPL consistently increases with RPM. The fluctuations observed at higher BPF harmonics over the RPM range can be explained by unsteady laminar boundary layer separation causing unsteady loading on the propeller blades.
-
Contra-Rotating Mejzlik 13 × 4.2 blades in hover: the first tonal peak SPL shows non-monotonic behavior as RPM increases, noticeable from 4200 RPM onwards. There are fluctuations in trend among microphone positions, with differences in SPL. The dominance of higher Blade Passing Frequencies (BPFs) harmonics suggests that a directivity noise map analysis is necessary. To examine how tonal noise is affected by the distance between propellers in the coaxial contra-rotating propeller configuration, an analysis was conducted. The results demonstrate that as the distance between propellers increases, fluctuations in tonal noise become more pronounced at higher RPMs. However, there were no significant changes in sound pressure level (SPL) across these distances. The SPL ranges between 60 to 65 dB between 4000 and 5000 RPM and increases to 70 to 80 dB between 5500 and 6000 RPM.
Funding
This research has been funded by the European Union in the framework of the H2020 RIA project ENODISE (Grant Agreement No. 860103).
Conflicts of interest
The Authors declare not having any financial relationship with the organization that sponsored the research. The Authors have full control of all primary data and they agree to allow the journal to review their data if requested.
Data availability statement
The research data associated with this article are available in the repository titled H2020 Enodise: Experimental dataset of con guration C VKI in Zenodo, under the reference https://doi.org/10.5281/zenodo.8334930 [25].
References
- S.D. Prior: Reviewing and investigating the use of co-axial rotor systems in small UAVs. International Journal of Micro Air Vehicles 2 (2010) 1–16. [CrossRef] [Google Scholar]
- W. Ong, S. Srigrarom, H. Hesse: Design methodology for heavy-lift unmanned aerial vehicles with coaxial rotors, in: AIAA Scitech 2019 Forum, 2019, p. 2095. [Google Scholar]
- A.J. Torija, P. Chaitanya, Z. Li: Psychoacoustic analysis of contra-rotating propeller noise for unmanned aerial vehicles. The Journal of the Acoustical Society of America 149, 2 (2021) 835–846. [CrossRef] [PubMed] [Google Scholar]
- P. Candeloro, D. Ragni, T. Pagliaroli: Small-scale rotor aeroacoustics for drone propulsion: a review of noise sources and control strategies. Fluids 7, 8 (2022) 279. [CrossRef] [Google Scholar]
- R.S. McKay, M.J. Kingan, S.T. Go, R. Jung: Experimental and analytical investigation of contra-rotating multi-rotor UAV propeller noise. Applied Acoustics 177 (2021) 107850. [CrossRef] [Google Scholar]
- P. Chaitanya, P. Joseph, S.D. Prior, A.B. Parry: On the optimum separation distance for minimum noise of contra-rotating rotors. Journal of Sound and Vibration 535 (2022) 117032. [CrossRef] [Google Scholar]
- C. Ramos-Romero, N. Green, A.J. Torija, C. Asensio: On-field noise measurements and acoustic characterisation of multi-rotor small unmanned aerial systems. Aerospace Science and Technology 141 (2023) 108537. [CrossRef] [Google Scholar]
- P. Naz, S. Hengy, A. Ramamonjy, O. Rassy, E. Bavu: Outdoor field trials for the measurement of the acoustic signals of mini UAVs, in: e-Forum Acusticum 2020, 2020, pp. 3155–3162. [Google Scholar]
- M. Brazinskas, S.D. Prior, J.P. Scanlan: An empirical study of overlapping rotor interference for a small unmanned aircraft propulsion system. Aerospace 3, 4 (2016) 32. [CrossRef] [Google Scholar]
- Z. Wang, Q. Henricks, M. Zhuang, A. Pandey, M. Sutkowy, B. Harter, M. McCrink, J. Gregory: Impact of rotor–airframe orientation on the aerodynamic and aeroacoustic characteristics of small unmanned aerial systems. Drones 3, 3 (2019) 56. [CrossRef] [Google Scholar]
- S.D. Prior, J.C. Bell: Empirical measurements of small unmanned aerial vehicle co-axial rotor systems. Journal of Science and Innovation 1, 1 (2011) 1–18. [Google Scholar]
- S. Whiteside, N. Zawodny, X. Fei, N.A. Pettingill, M.D. Patterson, P. Rothhaar: An exploration of the performance and acoustic characteristics of UAV-scale stacked rotor configurations, in: AIAA Scitech 2019 Forum, 2019, p. 1071. [Google Scholar]
- G. Jacobellis, R. Singh, C. Johnson, J. Sirohi, R. McDonald: Experimental and computational investigation of stacked rotor performance in hover. Aerospace Science and Technology 116 (2021) 106847. [CrossRef] [Google Scholar]
- S. Platzer, M. Hajek, J. Rauleder, P. Mortimer, J. Sirohi: Investigation of the flow fields of coaxial stacked and counter-rotating rotors using PIV measurements and URANS simulations, in: Proceedings of the Vertical Flight Society’s 77th Annual Forum and Technology Display, Virtual, 2021, pp. 10–14. [Google Scholar]
- D.W. Kurtz, J.E. Marte: A review of aerodynamic noise from propellers, rotors, and lift fans, 1970. [Google Scholar]
- R.A. Piziali, F.F Felker: Reduction of unsteady recirculation in hovering model helicopter rotor testing. Journal of the American Helicopter Society 32, 1 (1987) 54–59. [CrossRef] [Google Scholar]
- R.W. Paterson, R.K. Amiet: Noise of a model helicopter rotor due to ingestion of turbulence. Technical report, 1979. [Google Scholar]
- J.H. Stephenson, D. Weitsman, N.S. Zawodny: Effects of flow recirculation on unmanned aircraft system (UAS) acoustic measurements in closed anechoic chambers. The Journal of the Acoustical Society of America 145, 3 (2019) 1153–1155. [CrossRef] [PubMed] [Google Scholar]
- D. Weitsman, J.H. Stephenson, N.S. Zawodny: Effects of flow recirculation on acoustic and dynamic measurements of rotary-wing systems operating in closed anechoic chambers. The Journal of the Acoustical Society of America 148, 3 (2020) 1325–1336. [CrossRef] [PubMed] [Google Scholar]
- O. Hertzman, S. Fligelman, O. Stalnov: Abatement of a multi-rotor tonal noise component with phase control technology, in: 28th AIAA/CEAS Aeroacoustics 2022 Conference, 2022, p. 2834. [Google Scholar]
- C.R. Russell, J. Jung, G. Willink, B. Glasner: Wind tunnel and hover performance test results for multicopter UAS vehicles, in: American Helicopter Society (AHS) International Annual Forum and Technology Display, number ARC-E-DAA-TN31096, 2016. [Google Scholar]
- ISO ISO3744: Acoustics–determination of sound power levels and sound energy levels of noise sources using sound pressure–engineering methods for an essentially free field over a reflecting plane. International Standards Organization, Geneva, Switzerland, 2010. [Google Scholar]
- M. Bilka, J. Anthoine, C. Schram: Design and evaluation of an aeroacoustic wind tunnel for measurement of axial flow fans. The Journal of the Acoustical Society of America 130, 6 (2011) 3788–3796. [CrossRef] [PubMed] [Google Scholar]
- R.W. Deters, S. Kleinke, M.S. Selig: Static testing of propulsion elements for small multirotor unmanned aerial vehicles, in: 35th AIAA Applied Aerodynamics Conference, 2017, p. 3743. [Google Scholar]
- E. Gallo, J. de Decker, P. Haezebrouck, A. Zarri, C. Schram: H2020 Enodise: experimental dataset of configuration C VKI, September 2023. [Google Scholar]
- S. Glegg, W. Devenport: Chapter 8 – turbulence and stochastic processes, in: S. Glegg, W. Devenport, (Eds.) Aeroacoustics of Low Mach Number Flows. Academic Press, 2017, pp. 163–184. [CrossRef] [Google Scholar]
- F. Jacobsen, T. Poulsen, J.H. Rindel, A.C. Gade, M. Ohlrich: Fundamentals of acoustics and noise control, 2011. [Google Scholar]
Appendix A
Aerodynamic sensors calibration
A.1 Loadcell
A.1.1 Temperature correction factor
This section outlines the calibration procedure applied for the load cell to characterize the impact of the system on the instrument. The initial step involves investigating the accuracy of the sensor, with a focus on the influence of temperature. A potential error in the instrument output is linked to temperature variations, as indicated in the technical specifications. This aspect is particularly important in a test rig with motors spinning at high RPM. The increase of loadcell temperature over time is shown in Figure A.1. The data has been recorded with cooling system activated, showing that an initial stabilization time is required to attain a consistent temperature. A temperature correction factor k expressed in equation (A.1) has been computed and applied to the averaged thrust signal T. The temperature θ was averaged within two distinct Regions of Interest, highlighted in gray in Figure A.1. More precisely, in equation (A.1), the subscripts 1 and 2 correspond to the regions of interest (ROI) of the ramp and the assessment of the temperature, respectively, and the notation  indicate the time average.
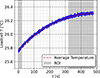 |
Figure A.1 Loadcell temperature over time measured with Mejzlik 2-blades mounted on the long shaft (6000 RPM). |
 (A.1)
(A.1)
The cooling system ensures a consistent sensor temperature over time, as illustrated in Figure A.2. Following the initial stabilization period, the temperature at both motors and the loadcell remains stable, thereby preventing any significant variation in the acquisition.
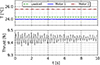 |
Figure A.2 Temperature of loadcell and motors, and loadcell signal over time measured with Mejzlik 2-blades mounted on the long shaft (6000 RPM). |
A.1.2 Calibration procedure
The calibration was carried out using a pulley, a cable fixed to the short shaft at one extremity, and weights supported by a plate of 71.74 g at the other. The corresponding values are reported in Table A.1.
Loadcell calibration weights.
The procedure involved spinning the long shaft at 4000 RPM along with the cooling system activated at 1.2 bar. This configuration proved to be the optimal solution as the instrument exhibited a stable signal over time, indicating a negligible influence of external factors such as vibrations. The calibration procedure for the load cell involved acquiring 10 data points for each entry in Table A.1. A cross-validation method was implemented as follows: initially, the dataset was randomly divided into two subsets: a training group (70%) and a validation group (30%). In consequence, a linear regression on the training data provided the regression parameters, slope, and intercept, denoted as a and b were saved. This process was iterated hundreds of times, generating multiple regressions. For each iteration, the Root Mean Square Error (RMSE) was calculated for both testing and validation datasets. The distribution of a and b was then computed. The calibration curve is expressed by the following equation:
 (A.2)
(A.2)
with Ta the applied thrust. A T-Student estimator on the parameter a standard deviation was applied to compute the uncertainty associated with the intercept. The resulting uncertainty on the measurements corresponds to ±0.024 N. Finally, the offset has been recorded before each measurement.
A.2 Torque sensors
The static calibration was carried out for individual torque sensors using a simplified mock-up designed for a single motor. A metal arm was attached above the motor and a plate with cables at both ends was used to measure the torque applied under different weights (see Tab. A.1). The calibration curves yield the following equations:
 (A.3)
(A.3)
and
 (A.4)
(A.4)
with Qa the applied torque. The calibration curve has a positive trend for clockwise rotational direction, and a negative for counter-clockwise, according to the output of the sensors. The offset varies with the dynamic and friction effects of the coaxial setup, while the slope remains constant. Specifically, subscripts 1 and 2 denote the position of the torque sensor in the coaxial setup, with 1 indicating the sensor measuring torque at Motor 1, and 2 indicating the sensor measuring torque at Motor 2.
The extrapolation of the aerodynamic torque from the instrument signal required the separation of the system contribution related to the propeller itself. A protocol was therefore established to take account of this contribution, consisting of measuring the torque of the rotating engine at each speed before and after each measurement. The offset measured by the rotating motors is sufficiently representative of the friction of the shaft. Figure A.3 shows the torque averaged at Motor 1 without load and the torque extracted for the DJI 9450 propeller, which is considered as the torque due to the propeller resistance.
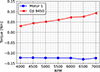 |
Figure A.3 Torque measured at Motor 1 with and without propeller. |
Appendix B
Repeatability of acoustic measurements
The following section aims to ensure the reliability and consistency of acoustic measurements. The noise generated by contra-rotating propellers poses challenges due to interference effects caused by the uncontrolled phase angle between the propellers. Although the propellers operate at the same nominal RPM, slight variations result in the front and rear propellers not aligning at the same circumferential position at each rotation. This effect might introduce variability into the noise measurements. As a consequence, the phase-independent repeatability of the measurements must be verified to ensure a reliable analysis.
Therefore, the same measurement was repeated at the same microphone three times. Figure B.1 shows the SPL of contra-rotating Mejzlik 2-blades propeller at 6000 RPM and d = 3 cm measured at Mic 3 over a duration of 10 s. The SPL spectra confirm that the generated noise remains consistent at the BPFs, showing no differences in the tonal peaks across the three cases. This outcome indicates that the time frame is sufficient to average out transient effects, suggesting that the results are repeatable and not significantly affected by phasevariations.
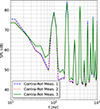 |
Figure B.1 Noise measured with contra-rotating Mejzlik 2-blades propeller at 6000 RPM and d = 3 cm at Mic 3. |
Cite this article as: Gallo E. De Decker J. Bresciani A. Haezebrouck P. Garone E. & Schram C. 2025. Development and commissioning of an aeroacoustic test bench for the investigation of single and coaxial propeller noise. Acta Acustica, 9, 16. https://doi.org/10.1051/aacus/2024085.
All Tables
All Figures
|
Figure 1 Alcoves facility scheme. |
| In the text | |
|
Figure 2 Fairing, cooling hose, supporting stand, and microphone setup in the anechoic room ALCOVES. |
| In the text | |
|
Figure 3 Top: layout of the motors, shafts, and bearings. Bottom: integration on the sliding frame (blue) connected to the fixed frame (cyan) through low-friction ball sleeves. |
| In the text | |
|
Figure 4 Top view with dimensions of the microphone array scheme composed of 24 sensors used in ALCOVES. The origin of the reference system is set in the center of the rear propeller disk. |
| In the text | |
|
Figure 5 Microphone setup in ALCOVES. |
| In the text | |
|
Figure 6 From the top: (i) Mejzlik 13′′ × 4.2 propeller counter-clockwise used at rear position, (ii) Mejzlik 13′′ × 4.2 clockwise propeller used at front position, and (iii) DJI 9450 propeller. |
| In the text | |
|
Figure 7 SPL of anechoic room, cooling system, motors alone and isolated Mejzlik 2-blades propellers at 6000 RPM measured at Mic A. |
| In the text | |
|
Figure 8 SPL spectrogram of isolated Mejzlik 2-blades propellers at 6000 RPM measured at Mic A. |
| In the text | |
|
Figure 9 Thrust and power coefficients, C T and C p , of DJI 9450 propeller measured in ALCOVES laboratory, VKI. The reference data for the DJI 9450 are extracted from the literature [21, 24] (U ∞ = 0). |
| In the text | |
|
Figure 10 Noise measured with DJI 9450 at 5250 RPM, scaled with distance, and compared to existing literature [19]. |
| In the text | |
|
Figure 11 Thrust and power coefficients, C T and C p , of single and coaxial contra-rotating Mejzlik 13 × 4.2 propeller configurations. For the coaxial cases, the longitudinal separation between the two propeller planes is varied from d = 2 to 4 cm. |
| In the text | |
|
Figure 12 Map of the SPL at the 1st BPF measured with single Mejzlik 2-blades propeller at 6000 RPM (U ∞ = 0). The propeller disk side and front view are outlined in black. |
| In the text | |
|
Figure 13 Map of the SPL at the 1st BPF measured with contra-rotating Mejzlik 2-blades propeller at 6000 RPM (d = 3 cm, U ∞ = 0). The propeller disk side and front view are outlined in black. |
| In the text | |
|
Figure 14 Tonal noise of 1st, 2nd, 3rd, and 4th BPF harmonics for single Mejzlik 2-blades propeller operating measured at Mic A, B and C (6000 RPM, U∞ = 0). (a) 1st BPF. (b) 2nd BPF. (c) 3rd BPF. (d) 4th BPF. |
| In the text | |
|
Figure 15 Tonal noise of 1st, 2nd, 3rd, and 4th BPF harmonics for contra-rotating Mejzlik 2-blades propeller measured at Mic A, B and C (6000 RPM, d = 4 cm, U ∞ = 0). (a) 1st BPF. (b) 2nd BPF. (c) 3rd BPF. (d) 4th BPF. |
| In the text | |
|
Figure 16 1st tones measured with contra-rotating Mejzlik 2-blades propeller at Mic A at a varying distance and RPM (U ∞ = 0). |
| In the text | |
|
Figure A.1 Loadcell temperature over time measured with Mejzlik 2-blades mounted on the long shaft (6000 RPM). |
| In the text | |
|
Figure A.2 Temperature of loadcell and motors, and loadcell signal over time measured with Mejzlik 2-blades mounted on the long shaft (6000 RPM). |
| In the text | |
|
Figure A.3 Torque measured at Motor 1 with and without propeller. |
| In the text | |
|
Figure B.1 Noise measured with contra-rotating Mejzlik 2-blades propeller at 6000 RPM and d = 3 cm at Mic 3. |
| In the text | |
Current usage metrics show cumulative count of Article Views (full-text article views including HTML views, PDF and ePub downloads, according to the available data) and Abstracts Views on Vision4Press platform.
Data correspond to usage on the plateform after 2015. The current usage metrics is available 48-96 hours after online publication and is updated daily on week days.
Initial download of the metrics may take a while.