Figure 5
Download original image
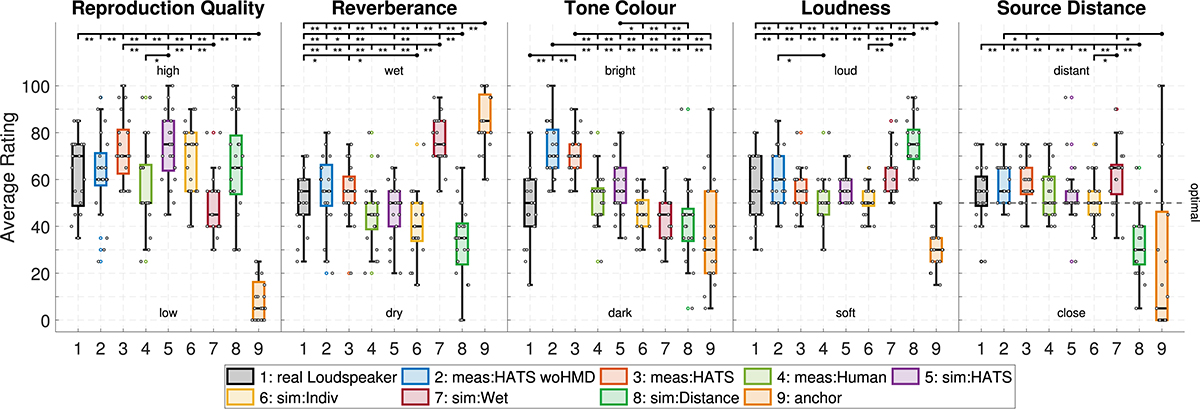
Box plots showing the ratings averaged over the repeated measurements as a function of the BRIRs for each rated room-acoustic attribute. Statistically significant differences (repeated measures ANOVA, for source distance non-parametric Wilcoxon signed rank test, both corrected by Bonferroni-Holm) are presented, starting from the dot and refer to each downward tick on the respective line. The corresponding significance asterisk is placed below the line near the downward tick.
Current usage metrics show cumulative count of Article Views (full-text article views including HTML views, PDF and ePub downloads, according to the available data) and Abstracts Views on Vision4Press platform.
Data correspond to usage on the plateform after 2015. The current usage metrics is available 48-96 hours after online publication and is updated daily on week days.
Initial download of the metrics may take a while.