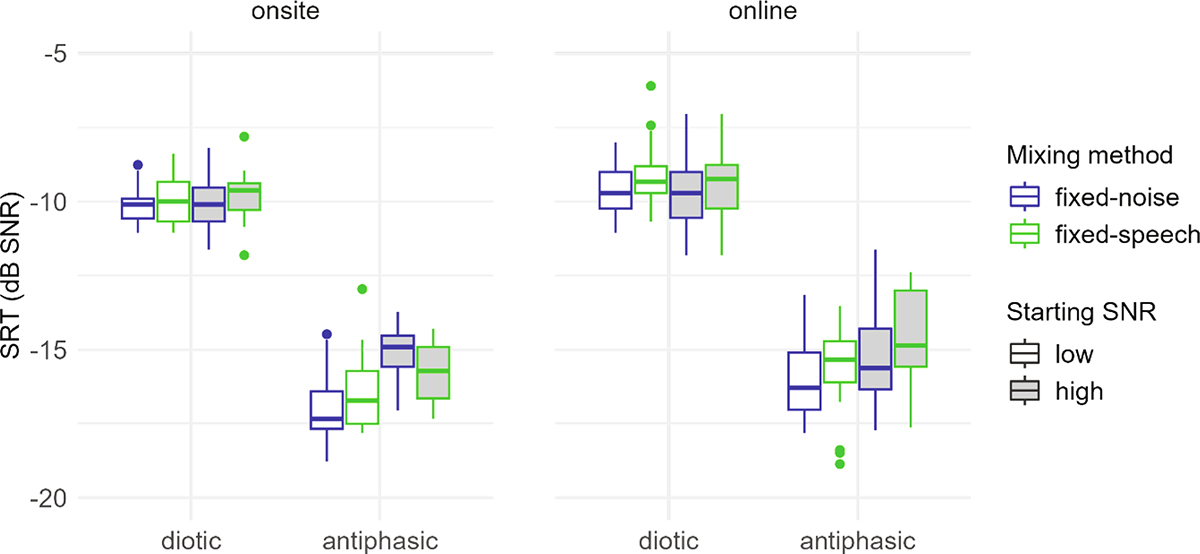
Figure 3.
Download original image
The onsite (left panel) and online (right panel) DIN test scores (dB SNR) for sound presentation (shown on the left and right sides of panels for diotic and antiphasic, respectively), starting SNR (low, high), and mixing method (fixed-speech, fixed-noise, and fixed-level). The boxplots show the lower and upper quartiles and the lines show the median scores of participants (N=22). The dots represent outliers, and the whiskers indicate the lowest and highest data points within plus or minus 1.5 times the interquartile range.
Current usage metrics show cumulative count of Article Views (full-text article views including HTML views, PDF and ePub downloads, according to the available data) and Abstracts Views on Vision4Press platform.
Data correspond to usage on the plateform after 2015. The current usage metrics is available 48-96 hours after online publication and is updated daily on week days.
Initial download of the metrics may take a while.