| Issue |
Acta Acust.
Volume 9, 2025
|
|
|---|---|---|
| Article Number | 47 | |
| Number of page(s) | 11 | |
| Section | Hearing, Audiology and Psychoacoustics | |
| DOI | https://doi.org/10.1051/aacus/2025032 | |
| Published online | 24 July 2025 | |
Scientific Article
Digits-in-Noise test implementations for onsite and online testing with normal-hearing adults
1
Department of Otorhinolaryngology/Head and Neck Surgery, University Medical Center Groningen, University of Groningen Hanzeplein 1 9713GZ Groningen Netherlands
2
Research School of Behavioral and Cognitive Neuroscience, University of Groningen Groningen Netherlands
3
W.J. Kolff Institute for Biomedical Engineering and Materials Science, University Medical Center Groningen, University of Groningen Groningen Netherlands
4
CNRS UMR 5292, Lyon Neuroscience Research Center, Auditory Cognition and Psychoacoustics, Inserm UMRS 1028, Université Claude Bernard Lyon 1, Université de Lyon Lyon France
* Corresponding author: This email address is being protected from spambots. You need JavaScript enabled to view it.
Received:
8
October
2024
Accepted:
30
June
2025
Abstract
Introduction: To investigate the effects of frequently used variations of the Digits-in-Noise (DIN) test on speech reception threshold (SRT) for onsite and online implementations.
Methods: We tested various DIN test implementations in a within-subject design on 30 normal-hearing adults onsite, with 22 of them also online. We varied three parameters: (1) sound presentation, diotic or antiphasic; (2) starting signal-to-noise ratio (SNR), 0 or −16 dB; and (3) mixing method, with fixed presentation level of the speech, the noise, or the speech and noise mix (tested onsite only).
Results: Antiphasic presentation yielded significantly lower DIN SRTs than diotic by around 6 dB. The effects of starting SNR and mixing method were significant but small, around 1−2 dB. These effects seemed more pronounced with antiphasic presentation. Overall, onsite and online DIN test results were comparable, with the largest observed difference being 1.30 dB.
Conclusion: The selection of diotic or antiphasic sound presentation seems important, and antiphasic presentation may result in a more sensitive test. In contrast, the effects of the other parameters were small. The comparable onsite and online outcomes indicate that online testing via the internet could be a viable option for making the DIN test available to large populations.
Key words: Digits-in-Noise test / Speech reception threshold / Speech audiometry / Hearing screening test
© The Author(s), Published by EDP Sciences, 2025
 This is an Open Access article distributed under the terms of the Creative Commons Attribution License (https://creativecommons.org/licenses/by/4.0), which permits unrestricted use, distribution, and reproduction in any medium, provided the original work is properly cited.
1 Introduction
The Digits-in-Noise (DIN) test [1–3] is a closed-set, adaptive, speech-in-noise test initially designed for hearing screening of adults (Dutch National Hearing Test). Digits were chosen since they require only a minimal demand on the listener's linguistic abilities [1, 4]. Even though digits are not an exhaustive representation of speech in daily listening, the results of the DIN test were shown to be strongly correlated with other speech-in-noise tests using open-set materials, such as sentences [3]. The DIN test, originally developed in Dutch, was later adapted to other languages, such as French, German, and English [5–7], and was also used to assess the efficacy of hearing aids and cochlear implants [8, 9].
The original design of the DIN test consisted of digits (0–9) presented as a sequence of triplets in stationary noise [3]. The listener's task was to repeat the digits in order of presentation. Depending on the condition, either speech or noise level was fixed at 65 dBA for normal-hearing listeners, and the level of the noise or the speech was adaptively adjusted. The masker noise used had the same average long-term spectrum as the recorded digits, and the relative noise level was adjusted using a 1-up, 1-down adaptive staircase across 24 trials. The starting signal-to-noise ratio (SNR) was 0 dB, which was increased by 2 dB after an incorrect response and decreased by 2 dB after a correct response. The final DIN test score was the speech reception threshold (SRT), calculated by averaging the SNR outcomes from the last 21 trials.
Studies following the original implementation used slightly modified versions of the DIN test more suited for various populations, such as users of different hearing devices [8, 10] or listeners of varying ages [11, 12]. In a comprehensive review, Van den Borre et al. (2021) compiled 39 studies related to the “digit triplet test” and “digits in noise” to investigate which aspects of the digit triplet tests can be adapted to increase its validity, reliability, and feasibility [13]. The authors discuss several parameters that differ between the studies, including the sound presentation method (e.g., diotic, antiphasic), procedural aspects (e.g., number of trials, starting SNR), mixing method of speech and noise levels (e.g., fixed-noise level or fixed-overall-level), and platform (e.g., online or onsite tests with varying setups, such as landline telephone, mobile phone, or varying speakers or headphones). In the current study, we investigated the effects of a subset of these parameters that are often modified across studies (sound presentation, starting SNR, mixing method) on DIN SRTs within a normal-hearing adult population, onsite and online. With a systematic approach, we aimed to propose standard DIN test specifications and facilitate sharing, combining, and comparing data across these various implementations.
Sound presentation in the DIN test can be monaural, generally in the better ear, or diotic, presented to both ears [14, 15]. Diotic stimuli have been used to present the test to both ears simultaneously instead of testing each ear separately [14], which reduces test duration [16]. However, the use of diotic stimuli primarily reflects the performance of the better ear and does not allow the detection of unilateral or asymmetric hearing loss [17]. Despite this limitation, the diotic DIN test has shown good sensitivity and specificity rates for identifying disabling hearing loss based on the better ear pure-tone average [18]. Additionally, some studies used antiphasic stimuli where the phase of the speech signal was reversed in one ear, whereas the noise masker was still diotic. Smits et al. (2016) showed that such antiphasic stimuli produce lower SRTs (better performance) than diotic stimuli for normal-hearing participants [19]. Moreover, using these antiphasic stimuli results in greater sensitivity and specificity between normal-hearing and hearing-impaired listeners, with symmetric or asymmetric sensorineural hearing loss and conductive hearing loss [17].
The starting SNR in the original DIN test was 0 dB, thereafter using a staircase procedure with 2 dB steps [3]. This design was adopted by many studies. However, some studies with hearing-impaired populations used starting SNRs (e.g., −3, −4, −8 dB) closer to the expected threshold [5, 8, 20]. Using more targeted starıng SNR reduces the number of incremental steps needed to reach the initial threshold. Some studies varied the total number of trials and the number of initial trials that were omitted, as compared to the original design [3]. As mentioned by Van der Borre et al. (2021), the SNR of the first trials will still be converging to the SRT (when starting above threshold) and can also be affected by a procedural learning effect [13, 15]. To accommodate the variability in SRTs among hearing-impaired populations, some studies adapt the procedure by using a starting SNR below the expected threshold and repeating the first digit triplet (using a larger initial step size) until it is correctly repeated [8, 9, 21, 22].
Different mixing methods for mixing speech and noise have been applied to adjust the SNR of the DIN test. Some studies [1] have used fixed noise levels while the level of speech was adjusted, and others [12, 23] fixed speech level. Another option is to adjust the SNR while keeping the absolute level of the speech-noise mix fixed [8, 21]. It may be important to choose a mixing method (fixed-speech, fixed-noise, or fixed-level) that presents speech and noise levels in the (potentially reduced) dynamic range of the tested population, preventing either noise from becoming too loud or speech falling below the listeners’ hearing threshold.
Various platforms, both onsite and online (remote), have been used for the DIN test over the years. The DIN test, in the form of the Dutch National Hearing Test for adult hearing screening, was originally applied over the landline telephone. Despite the telephone's limited bandwidth, it was sufficient to identify the high-frequency hearing loss prevalent among adults [1]. Early mobile phone implementations in 2005 yielded less reliable results due to the technological limitations of devices at the time [2]. In the following years, many clinical and consumer apps have been developed for screening purposes [24]. More recent research showed that using different-quality headphones does not substantially affect DIN test outcomes [14]. Moreover, the integration of sophisticated hardware, software, and network systems has allowed for the collection of robust data online, thereby enhancing participant recruitment and logistical flexibility while preserving the test's validity [25, 26].
In the current study, we investigated the effects of frequently used variations of the DIN test on SRTs, onsite and online. We focused on the parameters of the sound presentation, starting SNR, and mixing method, evaluated in relatively young adult normal-hearing individuals. While previous studies have investigated these parameters individually or in small combinations, no study has investigated the combined effects of the three aforementioned parameters on a single population (within-subject design). This approach allows for a systematic evaluation of how each parameter, separately and in combination, affects DIN outcomes in a single normal-hearing group. Based on previous studies, we hypothesize that (H1) sound presentation, diotic or antiphasic, will affect the DIN test score [19]; (H2) starting SNR will likely produce negligible shifts, within the 1 dB measurement error range [3, 27]. While starting SNR effects are well documented for diotic conditions, they remain less explored for antiphasic presentation in normal-hearing listeners. (H3) the mixing method will not affect the DIN test score, in line with Van den Borre et al. (2021) [13]; and (H4) there will be no significant difference between onsite and online DIN test scores of participants with normal hearing [26].
2 Materials and methods
2.1 Participants
Thirty native Dutch speaker adults (self-reported gender: 22 female; 8 male; age range: 18–43 years, mean age: 23.9±4.5 years) participated in the onsite DIN testing. Twenty-two of them (self-reported gender: 17 female; five male; age range: 18–43 years, mean age: 24.7±4.8 years) also participated in the online DIN testing. All participants reported having no neurological or cognitive impairment, and reported to have normal hearing and normal or corrected-to-normal vision. Recruitment was via word of mouth at the University Medical Center Groningen and the University of Groningen. Participants provided written informed consent and received an hourly compensation of 8 euros by departmental guidelines for participant reimbursement. The study protocol was approved by the Ethics Committee of the University Medical Center Groningen (METc 2018/427).
From the 30 participants, one had HAVO (pre-higher vocational education), seven HBO (higher vocational education), and 22 WO (university-level education), all according to the Dutch schooling system. All reported to have learned two or more languages in addition to their first language (12 learned three additional languages, four learned four additional languages). No participant reported to be bilingual, and 16 participants played a musical instrument, 10 of which received formal music education before the age of 10. Note that most participants were recruited at the university, which is important to consider when generalizing our findings to a broader population, as educational level has been shown to influence certain speech-in-noise outcomes [28].
2.2 Pure tone audiometry
We characterized normal hearing using standard clinical pure tone audiometry. All participants had normal hearing thresholds of ≤20 dB hearing level (HL) at the audiometric octave frequencies between 250 and 8000 Hz for both ears, except for two participants, who were still included in the analysis. One of these two participants had 30 dB HL at 8000 Hz in the right ear and 25 dB HL at 4000 Hz in the left ear, and the other participant had 30 dB HL at 8000 Hz in the right ear and 25 dB HL at 8000 Hz in the left ear.
2.3 DIN stimuli and implementations
For both the onsite and online DIN tests, we used the original Dutch stimuli developed by Smits et al. (2013) [3]. The stimuli consisted of ten digits (0 to 9), recorded by a male speaker. Smits et al. first aligned the level of the individual digits based on their speech recognition functions at 50% intelligibility. Next, from these ten digits, 120 unique sets of digit triplets, each composed of three different digits, were constructed. Using the calculation model of Smits and Houtgast (2006), digit triplets with a maximum slope of the speech recognition function and coinciding 50% points were created [29]. These digit triplets were organized into 10 distinct lists, each containing 24 triplets, for testing. These test triplets were created by combining the recorded audio files of three individual digits, including 150 ms silent intervals between the digits. They were presented in diotic [3] or antiphasic (phase-reversed speech in one ear) fashion [19] in speech-shaped noise with the same long-term average spectrum of the spoken digits. The masker noise started 100 ms before and stopped 100 ms after the presentation of each triplet. For more details on creating these stimuli, see Smits et al. (2013) [3].
We have implemented the DIN test in MATLAB (R2020a, MathWorks, Natick, MA, USA) for the onsite version, and jsPsych (v6.3.1) for the online version. The procedures of both onsite and online versions were based on the parameters published as an open generic specification on the dB SPLab GitHub repository [30]. The design of the onsite version of the experiment included the following conditions: sound presentation (diotic, antiphasic), starting SNR (low, high), and mixing method (fixed-speech, fixed-noise, and fixed-level) as the within-subject factors, which resulted in a total of 12 conditions. The design of the online version included: sound presentation (diotic, antiphasic), starting SNR (low, high), and mixing method (fixed-speech and fixed-noise) as the within-subject factors, which resulted in a total of 8 conditions. The order of the DIN test conditions (12 onsite, 8 online) was randomized for each participant.
In both the onsite and online versions of the DIN test, the starting SNR was set to 0 dB for the high SNR condition and to −16 dB for the low SNR condition. Following, the adaptive staircase procedure used 2 dB steps. If the participant incorrectly repeated the triplet, the SNR was increased by 2 dB for the following triplet. In contrast, if the participant correctly repeated the triplet, the SNR was decreased by 2 dB for the next triplet. Moreover, in the low SNR condition, the first digit triplet was repeated until the participant correctly identified all three digits. The initial step size was 4 dB until the first triplet was correctly repeated, after which the step size changed to 2 dB. The DIN SRT was calculated by averaging over the last 21 SNRs (5–25). Although no 25th triplet was presented, its SNR was calculated using the response to the 24th triplet. The stimuli used in both onsite and online platforms were limited to a range between −20 dB SNR and +20 dB SNR to maintain good audio quality and prevent the presentation level from becoming too loud.
2.4 Procedure
Participants were informed about the study and provided written informed consent. Following the pure-tone audiometry, participants performed the onsite DIN test. After the onsite session, participants received unique links and instructions for completing the online DIN test session, at a place and time of their convenience. No separate practice round was administered before the DIN test. Participants received detailed instructions and were able to ask questions prior to starting, and with random order of the DIN test variations, a potential learning effect was not limited to one specific condition.
The onsite DIN test procedure was mainly based on the DIN protocol by Smits et al. (2013) [3]. For each of the 12 DIN tests of the onsite DIN session, a list of digits was randomly selected from the 10 available lists from the original Dutch DIN test material. The task instruction was the same for each version. The participants clicked with a mouse on a number pad to indicate the digits they heard in the same order of presentation (interface shown in Fig. 1). If participants made an error or wanted to change their response, they could use the “delete” button to correct their input. Once a DIN test was completed, a new test screen automatically appeared in MATLAB, and participants initiated the subsequent test by simply clicking the “start” button. After completing the 12 DIN tests, participants were given a short break.
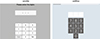 |
Figure 1. The interface of the onsite (left panel) and online (right panel) versions of the DIN test. |
After the onsite session, 22 participants also completed the online DIN session, which was similar to the onsite DIN test procedure with some exceptions. This session was performed on a different day, but within two weeks following the onsite session, and at a different location (e.g., participants’ homes). In the online session, participants performed eight online DIN tests, also randomly selected from the predefined 10 lists. Before starting the experiment, participants were informed about the test procedure. They were instructed to perform the online DIN session in a quiet environment, use good-quality headphones, adjust the sound level to a comfortable level, and keep the volume the same during the whole experiment. As in the onsite version of the DIN test, participants clicked with a mouse on a number pad to indicate the digits they heard in the same order of presentation. However, unlike the onsite DIN test, the online session did not include a “delete” button (see Fig. 1), which aligns with interfaces used for online testing [27]. After each test was completed, participants were asked to continue to the next test by clicking on the “next” button. The online DIN session was finished after participants completed all eight DIN tests.
The test session included 10 min for the audiometric threshold testing and nearly 30 min for the onsite version of the DIN test (12 different conditions). The total onsite session lasted around 1 h, which included breaks. The online DIN test session, including eight different conditions, took approximately 20 min to complete.
2.5 Apparatus
For onsite DIN testing, participants were seated in a sound-treated room facing a computer screen at a comfortable viewing distance (about 60 cm). The DIN test was conducted using MATLAB on a desktop computer (Mac mini; Apple, Cupertino, CA, USA). The sound stimuli were presented through a soundcard (Ultra-Lite mk4; MOTU, Cambridge, MA, USA) via headphones (HD 650; Sennheiser, Wedemark, Germany). The presentation level was calibrated to 65 dB SPL using the speech-shaped noise played through the headphones placed on the KEMAR Head & Torso simulator (GRAS Sound & Vibration, Holte, Denmark) and a SVAN 979 sound level meter (Svantek, Warsaw, Poland). We calibrated to 65 dB SPL instead of 65 dBA, which was used in the original implementation [3] because the KEMAR response already mimics some aspects of the ear-canal frequency response the A-weighting simulates. In the fixed-level condition, the overall level was thus set to 65 dB SPL, whereas for the fixed-speech and fixed-noise conditions, it was the speech or the noise, respectively, that were set to this level.
For online DIN testing, participants conducted the experiment at a self-chosen location (e.g., at home), using a web-based platform accessible through their personal computers. We used jsPsych [31] for the test implementation and hosted it with materials and data on our server. Unique links were provided to participants to access the test via a web browser. Volume adjustment was facilitated through a dedicated screen where a sample sound triplet (4–6–3) was presented in a noise masker. Participants adjusted the volume on their computers to a comfortable level, following the instructions provided, to ensure optimal testing.
2.6 Statistical analyses
For analyzing data, we used repeated measures analysis of variance (ANOVA) within-subject factors in SPSS (version 26). Sphericity was checked using Mauchly's test. In all ANOVAs, effect sizes were reported as partial eta-squared. All statistical tests were evaluated at a significance level of p<0.05. Post-hoc analysis was conducted with paired-sample t-tests in R [32]. The Holm-Bonferroni correction for multiple comparisons was used, and adjusted p-values are reported [33].
3 Results
3.1 Onsite DIN test
For the onsite DIN test data, we performed a 2×2×3 ANOVA on the DIN SRTs with three within-subject factors of sound presentation (diotic, antiphasic), starting SNR (low, high), and mixing method (fixed-speech, fixed-noise, and fixed-level). The sphericity assumption was met for all effects, therefore, no corrections were necessary. The three-way ANOVA showed a significant main effect of sound presentation (average DIN SRT for diotic =−10.03 dB SNR and antiphasic =−16.33 dB SNR) ![Mathematical equation: $ [F(1,29) = 2802.02, p \lt 0.001, \eta _{p}^{2} = 0.99] $](/articles/aacus/full_html/2025/01/aacus240120/aacus240120-eq1.gif) , a significant main effect of starting SNR (average DIN SRT for low =−13.52 dB SNR and high =−12.84 dB SNR)
, a significant main effect of starting SNR (average DIN SRT for low =−13.52 dB SNR and high =−12.84 dB SNR) ![Mathematical equation: $ [F(1,29) = 39.88, p \lt 0.001, \eta _{p}^{2} = 0.58] $](/articles/aacus/full_html/2025/01/aacus240120/aacus240120-eq2.gif) , and a significant main effect of the mixing method (average DIN SRT for fixed-speech =−13.02 dB SNR, fixed-noise =−13.18 dB SNR, and fixed-level =−13.49 dB SNR)
, and a significant main effect of the mixing method (average DIN SRT for fixed-speech =−13.02 dB SNR, fixed-noise =−13.18 dB SNR, and fixed-level =−13.49 dB SNR) ![Mathematical equation: $ [F(2,58) = 3.52, p = 0.036, \eta _{p}^{2} = 0.11] $](/articles/aacus/full_html/2025/01/aacus240120/aacus240120-eq3.gif) (Fig. 2). There were significant two-way interactions between sound presentation and starting SNR
(Fig. 2). There were significant two-way interactions between sound presentation and starting SNR ![Mathematical equation: $ [F(1,29) = 71.61, p \lt 0.001, \eta _{p}^{2} = 0.71] $](/articles/aacus/full_html/2025/01/aacus240120/aacus240120-eq4.gif) , as well as between starting SNR and mixing method
, as well as between starting SNR and mixing method ![Mathematical equation: $ [F(2,58) = 5.32, p = 0.008, \eta _{p}^{2} = 0.16] $](/articles/aacus/full_html/2025/01/aacus240120/aacus240120-eq5.gif) . The two-way interaction between sound presentation and mixing method was not significant
. The two-way interaction between sound presentation and mixing method was not significant ![Mathematical equation: $ [F(2,58) = 2.40, p = 0.100, \eta _{p}^{2} = 0.08] $](/articles/aacus/full_html/2025/01/aacus240120/aacus240120-eq6.gif) . Finally, there was a significant three-way interaction between sound presentation, starting SNR, and mixing method
. Finally, there was a significant three-way interaction between sound presentation, starting SNR, and mixing method ![Mathematical equation: $ [F(2,58) = 7.70, p = 0.001, \eta _{p}^{2} = 0.21] $](/articles/aacus/full_html/2025/01/aacus240120/aacus240120-eq7.gif) .
.
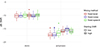 |
Figure 2. The onsite DIN test scores (dB SNR) for sound presentation (shown on the left and right sides for diotic and antiphasic, respectively), starting SNR (shown in the white or gray shade for low and high, respectively), and mixing method (shown in green, blue, and red colors for fixed-speech, fixed-noise, and fixed-level, respectively). The boxplots show the lower and upper quartiles and the lines show the median scores of participants. The dots represent outliers, and the whiskers indicate the lowest and highest data points within plus or minus 1.5 times the interquartile range. |
In order to explain the three-way interaction, the effects of starting SNR and mixing method were investigated separately for diotic and antiphasic sound presentations by means of two post-hoc 2×3 ANOVAs. For diotic sound presentation, neither starting SNR (average DIN SRT for low =−10.05 dB SNR and high =−10.02 dB SNR) ![Mathematical equation: $ [F(1,29) = 0.10, p = 0.751, \eta _{p}^{2} = 0.004] $](/articles/aacus/full_html/2025/01/aacus240120/aacus240120-eq8.gif) nor mixing method (average DIN SRT for fixed-speech =−9.86 dB SNR, fixed-noise =−10.14 dB SNR, and fixed-level =−10.10 dB SNR)
nor mixing method (average DIN SRT for fixed-speech =−9.86 dB SNR, fixed-noise =−10.14 dB SNR, and fixed-level =−10.10 dB SNR) ![Mathematical equation: $ [F(2,58) = 2.12, p = 0.130, \eta _{p}^{2} = 0.07] $](/articles/aacus/full_html/2025/01/aacus240120/aacus240120-eq9.gif) had significant effects. In addition, the interaction between the starting SNR and the mixing method was also not significant
had significant effects. In addition, the interaction between the starting SNR and the mixing method was also not significant ![Mathematical equation: $ [F(2,58) = 0.49, p = 0.617, \eta _{p}^{2} = 0.02] $](/articles/aacus/full_html/2025/01/aacus240120/aacus240120-eq10.gif) .
.
For antiphasic sound presentation, however, a significant main effect was shown for starting SNR (average DIN SRT for low =−16.98 dB SNR and high =−15.67 dB SNR) ![Mathematical equation: $ [F(1,29) = 77.46, p \lt 0.001, \eta _{p}^{2} = 0.73] $](/articles/aacus/full_html/2025/01/aacus240120/aacus240120-eq11.gif) and mixing method (average DIN SRT for fixed-speech =−16.17 dB SNR, fixed-noise =−16.22 dB SNR, and fixed-level =−16.60 dB SNR)
and mixing method (average DIN SRT for fixed-speech =−16.17 dB SNR, fixed-noise =−16.22 dB SNR, and fixed-level =−16.60 dB SNR) ![Mathematical equation: $ [F(2,58) = 3.88, p = 0.026, \eta _{p}^{2} = 0.12] $](/articles/aacus/full_html/2025/01/aacus240120/aacus240120-eq12.gif) . The interaction between the starting SNR and mixing method was significant
. The interaction between the starting SNR and mixing method was significant ![Mathematical equation: $ [F(2,58) = 9.53, p \lt 0.001, \eta _{p}^{2} = 0.25] $](/articles/aacus/full_html/2025/01/aacus240120/aacus240120-eq13.gif) . In order to explain the two-way interaction, post-hoc pairwise comparisons of the mixing methods for each starting SNR condition were performed, yielding six paired-sample t-tests. These revealed that for the low starting SNR condition, the SRT for fixed-speech was 0.81 dB lower (better performance) than that for fixed-level [t(29)=−3.73,padj<0.01]. For the high starting SNR condition, the SRT for fixed-noise was 0.60 dB lower than that for fixed-level [t(29)=−3.13,padj<0.05]. Other comparisons between mixing methods for both the low and high starting SNR conditions showed no significant effects (see Tab. 1).
. In order to explain the two-way interaction, post-hoc pairwise comparisons of the mixing methods for each starting SNR condition were performed, yielding six paired-sample t-tests. These revealed that for the low starting SNR condition, the SRT for fixed-speech was 0.81 dB lower (better performance) than that for fixed-level [t(29)=−3.73,padj<0.01]. For the high starting SNR condition, the SRT for fixed-noise was 0.60 dB lower than that for fixed-level [t(29)=−3.13,padj<0.05]. Other comparisons between mixing methods for both the low and high starting SNR conditions showed no significant effects (see Tab. 1).
Pairwise comparison of mixing methods for the two starting SNRs, in the onsite, antiphasic presentation condition.
3.2 Online DIN test
For the online DIN test data, we performed a 2×2×2 ANOVA on the DIN SRTs with sound presentation (diotic, antiphasic), starting SNR (low, high), and mixing method (fixed-speech, fixed-noise) as the within-subject factors. The sphericity assumption was met for all effects. The outcome of the three-way ANOVA showed a significant main effect for sound presentation (average DIN SRT for diotic =−9.48 dB SNR and antiphasic =−15.28 dB SNR) ![Mathematical equation: $ [F(1,21) = 1115.19, p \lt 0.001, \eta _{p}^{2} = 0.98] $](/articles/aacus/full_html/2025/01/aacus240120/aacus240120-eq14.gif) , starting SNR (average DIN SRT for low =−12.59 dB SNR and high −12.18 dB SNR)
, starting SNR (average DIN SRT for low =−12.59 dB SNR and high −12.18 dB SNR) ![Mathematical equation: $ [F(1,21) = 9.77, p = 0.005, \eta _{p}^{2} = 0.32] $](/articles/aacus/full_html/2025/01/aacus240120/aacus240120-eq15.gif) , and mixing method (average DIN SRT for fixed-speech =−12.16 dB SNR and fixed-noise =−12.60 dB SNR)
, and mixing method (average DIN SRT for fixed-speech =−12.16 dB SNR and fixed-noise =−12.60 dB SNR) ![Mathematical equation: $ [F(1,21) = 6.80, p = 0.016, \eta _{p}^{2} = 0.25] $](/articles/aacus/full_html/2025/01/aacus240120/aacus240120-eq16.gif) . There was a significant interaction between sound presentation and starting SNR
. There was a significant interaction between sound presentation and starting SNR ![Mathematical equation: $ [F(1,21) = 13.76, p = 0.001, \eta _{p}^{2} = 0.40] $](/articles/aacus/full_html/2025/01/aacus240120/aacus240120-eq17.gif) . Other interactions were not significant. For diotic sound presentation averaged over the mixing method conditions, a post-hoc paired-samples t-test showed no significant difference between the low and high starting SNRs [t(42)=0.38,p=0.709]. Conversely, antiphasic sound presentation (averaged over mixing method) revealed a significant difference between low and high starting SNRs [t(42)=−2.47,p=0.018].
. Other interactions were not significant. For diotic sound presentation averaged over the mixing method conditions, a post-hoc paired-samples t-test showed no significant difference between the low and high starting SNRs [t(42)=0.38,p=0.709]. Conversely, antiphasic sound presentation (averaged over mixing method) revealed a significant difference between low and high starting SNRs [t(42)=−2.47,p=0.018].
3.3 The comparison of the onsite and online DIN test scores
For the comparison of the onsite and online data, we performed a four-factor ANOVA (2×2×2×2) on the DIN SRTs with the platform (onsite, online), sound presentation (diotic, antiphasic), starting SNR (low, high), and mixing method (fixed-speech, fixed-noise) as within-subject factors. Figure 3 shows the comparison of DIN test data for the onsite and online platforms for the same 22 participants and the conditions that were included in both experiments. The outcomes show a significant main effect of the platform (average DIN SRT for onsite =−13.02 dB SNR and online =−12.38 dB SNR) ![Mathematical equation: $ [F(1,21) = 14.84, p = 0.001, \eta _{p}^{2} = 0.41] $](/articles/aacus/full_html/2025/01/aacus240120/aacus240120-eq18.gif) , sound presentation (average DIN SRT for diotic =−9.72 dB SNR and antiphasic =−15.68 dB SNR)
, sound presentation (average DIN SRT for diotic =−9.72 dB SNR and antiphasic =−15.68 dB SNR) ![Mathematical equation: $ [F(1,21) = 1773.97, p \lt 0.001, \eta _{p}^{2} = 0.99] $](/articles/aacus/full_html/2025/01/aacus240120/aacus240120-eq19.gif) , starting SNR (average DIN SRT for low =−12.97 dB SNR and high =−12.43 dB SNR)
, starting SNR (average DIN SRT for low =−12.97 dB SNR and high =−12.43 dB SNR) ![Mathematical equation: $ [F(1,21) = 32.12, p \lt 0.001, \eta _{p}^{2} = 0.61] $](/articles/aacus/full_html/2025/01/aacus240120/aacus240120-eq20.gif) . Although the effect sizes were substantial, the difference in SRT values between the conditions was relatively small, amounting to an average of only 0.64 dB SNR between the onsite and online DIN test scores. There was no significant effect for the mixing method (fixed-speech, fixed-noise)
. Although the effect sizes were substantial, the difference in SRT values between the conditions was relatively small, amounting to an average of only 0.64 dB SNR between the onsite and online DIN test scores. There was no significant effect for the mixing method (fixed-speech, fixed-noise) ![Mathematical equation: $ [F(1,21) = 5.13, p = 0.129, \eta _{p}^{2} = 0.11] $](/articles/aacus/full_html/2025/01/aacus240120/aacus240120-eq21.gif) . There was a two-way interaction between the sound presentation and starting SNR
. There was a two-way interaction between the sound presentation and starting SNR ![Mathematical equation: $ [F(1,21) = 71.72, p \lt 0.001, \eta _{p}^{2} = 0.77] $](/articles/aacus/full_html/2025/01/aacus240120/aacus240120-eq22.gif) and between the mixing method and platform
and between the mixing method and platform ![Mathematical equation: $ [F(1,21) = 5.91, p = 0.024, \eta _{p}^{2} = 0.22] $](/articles/aacus/full_html/2025/01/aacus240120/aacus240120-eq23.gif) . There was a three-way interaction between the starting SNR, mixing method and platform
. There was a three-way interaction between the starting SNR, mixing method and platform ![Mathematical equation: $ [F(1,21) = 4.67, p = 0.042, \eta _{p}^{2} = 0.18] $](/articles/aacus/full_html/2025/01/aacus240120/aacus240120-eq24.gif) ; and a four-way interaction between the sound presentation, starting SNR, mixing method and platform
; and a four-way interaction between the sound presentation, starting SNR, mixing method and platform ![Mathematical equation: $ [F(1,21) = 6.49, p = 0.019, \eta _{p}^{2} = 0.24] $](/articles/aacus/full_html/2025/01/aacus240120/aacus240120-eq25.gif) . None of the other effects were significant. We conducted separate post-hoc paired-sample t-tests to compare the differences between onsite and online platforms for all eight conditions. These results showed significant effects of platform for diotic sound presentation with low starting SNR and fixed-speech, where the onsite SRT was 0.75 dB lower than the online SRT. For antiphasic sound presentation, there was a significant effect for low starting SNR and fixed-noise (onsite SRT 1.12 dB lower) and high starting SNR and fixed-speech (onsite SRT 1.30 dB lower) (see Tab. 2). In all conditions, participants performed better in the onsite platform, except for the antiphasic sound presentation with high starting SNR and fixed-noise.
. None of the other effects were significant. We conducted separate post-hoc paired-sample t-tests to compare the differences between onsite and online platforms for all eight conditions. These results showed significant effects of platform for diotic sound presentation with low starting SNR and fixed-speech, where the onsite SRT was 0.75 dB lower than the online SRT. For antiphasic sound presentation, there was a significant effect for low starting SNR and fixed-noise (onsite SRT 1.12 dB lower) and high starting SNR and fixed-speech (onsite SRT 1.30 dB lower) (see Tab. 2). In all conditions, participants performed better in the onsite platform, except for the antiphasic sound presentation with high starting SNR and fixed-noise.
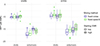 |
Figure 3. The onsite (left panel) and online (right panel) DIN test scores (dB SNR) for sound presentation (shown on the left and right sides of panels for diotic and antiphasic, respectively), starting SNR (low, high), and mixing method (fixed-speech, fixed-noise, and fixed-level). The boxplots show the lower and upper quartiles and the lines show the median scores of participants (N=22). The dots represent outliers, and the whiskers indicate the lowest and highest data points within plus or minus 1.5 times the interquartile range. |
Direct comparison of sound presentation, starting SNR, and mixing method parameters between onsite and online platforms as within-subject factors.
4 Discussion
The present study investigated the effect of sound presentation, starting SNR, and mixing method on DIN SRT scores in normal-hearing young adults, as conducted onsite and online. The outcomes of the current study showed that, for the onsite and online platforms, the sound presentation, starting SNR, and mixing method all affect the DIN test scores, but to differing degrees. In line with H1 and previous studies, differences in DIN test scores for the diotic and antiphasic sound presentations were shown for both onsite (6.30 dB) and online (5.80 dB) platforms [17, 19, 34]. However, against H2 and H3, both the starting SNR and mixing method results demonstrate an unexpected significant but small (all effects were <1 dB) effect on the onsite and online DIN test scores. Finally, against H4, there was a small (0.64 dB on average) but significant main difference between onsite and online tests.
4.1 Sound presentation
The DIN test results showed a significant difference between the diotic and antiphasic sound presentation conditions, both for the onsite (average DIN SRT for diotic =−10.03 dB and antiphasic =−16.33 dB, a difference of 6.30 dB) and online platforms (average DIN SRT for diotic =−9.48 dB and antiphasic =−15.28 dB, a difference of 5.80 dB). Our results support H1 that antiphasic sound presentation leads to lower thresholds (indicating better performance) compared to diotic, which is in line with Smits et al. [19]. The phase reversal in one ear in the antiphasic condition creates a spatially diffuse presentation of the target speech relative to the diotically presented masker, which leads to release from masking [35]. De Sousa et al. (2020) emphasized that the integration of sounds from both ears (binaural integration) improves speech perception in noise, especially when there is a phase difference between the ears [17].
4.2 Starting SNR
Contrary to H2, the DIN test scores differed significantly for starting SNR. Our results revealed that if the starting SNR was high (0 dB), participants, on average, reached a higher DIN SRT than for a low starting SNR (−16 dB). This effect of starting SNR was shown most prominently for the antiphasic conditions for both onsite and online DIN test outcomes. For the diotic conditions, starting SNR did not significantly impact the DIN test scores, which is consistent with Smits et al. [27]. They suggested that the starting SNR has a negligible effect (<0.1 dB) on the final SRT for normal-hearing individuals when its value is within 10 dB of the DIN SRT. Conversely, in the antiphasic conditions, for which the adaptive tracks plateaued around −17 dB SNR, significant effects of starting SNR were found on the DIN test scores. A likely cause for this effect is that, when the starting level was 0 dB SNR, it took participants a larger number of trials to reach their DIN test threshold than when the starting SNR was already close to the DIN SRT (see Fig. 4). The way the DIN test score is calculated, averaging over the last 21 SNRs, was originally based on the assumption that participants would reach near-threshold values within the first five steps of the adaptive staircase procedure. However, given the initial SNR of 0 dB and the step size of 2 dB, a participant cannot reach a threshold lower than −10 dB SNR within those 5 initial steps. In order to reach a threshold of −16 dB SNR, as shown in the results, at least eight steps are necessary. Needing more steps increased the DIN test score for antiphasic presentation and high starting SNR conditions. These findings were confirmed when recalculating the DIN SRTs using only the last 18 trials, where the effect of starting SNR, initially observed with 21 trials, became nonsignificant ![Mathematical equation: $ [F(1,29) = 1.41, p = 0.249, \eta _{p}^{2} = 0.05] $](/articles/aacus/full_html/2025/01/aacus240120/aacus240120-eq26.gif) . A similar change was observed when reanalyzing the online outcomes
. A similar change was observed when reanalyzing the online outcomes ![Mathematical equation: $ [F(1,21) = 0.84, p = 0.369, \eta _{p}^{2} = 0.04] $](/articles/aacus/full_html/2025/01/aacus240120/aacus240120-eq27.gif) .
.
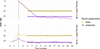 |
Figure 4. Average adaptive tracks showing SNR as a function of trial number, for a starting SNR of 0 dB (top) and −16 dB (bottom) and for diotic (light, yellow) and antiphasic (dark, purple). The trials are numbered such that 1 (marked with a vertical line) corresponds to the first adaptive trial when the first trial is repeated until correct (bottom). The horizontal line shows the average over the last 21 trials. |
4.3 Mixing method
Different from H3 and from what is shown in the literature [13], the mixing method had a significant main effect on the onsite (antiphasic) and online DIN test scores. For the onsite conditions, the SRTs for fixed-speech were significantly higher (by 0.5 dB) from those obtained with fixed-level for the low starting SNR, while the SRTs for fixed-noise were significantly higher (by 0.3 dB) than those obtained with fixed-level for the high starting SNR. When choosing a mixing method, the main concern is that the levels of both target speech and noise masker stay within the dynamic hearing range of the listener. Speech presentation levels should stay above the participant's audibility threshold, which is a concern for the fixed-noise condition, since speech levels are adaptively changed. In practice, those levels can become low if the listener's SRT is low. Masker noise levels can become loud for fixed-speech conditions, when a participant has a low SRT. For example, in the antiphasic low starting SNR condition in the onsite experiment, the noise level for fixed-speech reached levels above 80 dB SPL. These elevated noise levels might have had a negative impact on participants’ performance, as reflected by the current results. Even in normal-hearing participants, speech perception may be hindered at higher presentation levels. This decline in performance is not only due to participants being agitated by high presentation levels but also because spectral resolution can be affected [36, 37]. This effect is one of the reasons why different mixing methods may be more appropriate for specific populations. These observations also serve as a reminder that presentation levels have to be capped in the DIN test due to its adaptive procedure, not only to protect the participant from loud levels, but also to ensure that the data is not contaminated by the potential level-related spectral smearing effect described above. In the design of the current study, for this purpose the stimuli were limited to a range between −20 dB SNR and +20 dB SNR. Accordingly, saturation of the results was observed for some of the participants in the antiphasic listening conditions, which might have led to a slight underestimation of their performance. Note that this performance saturation only affects high performing individuals and will not occur with hearing impaired listeners that do not reach these low SRT.
4.4 Platform
Against H4, there was a statistically significant difference between the onsite and online DIN test scores in some conditions, with the largest observed difference being 1.30 dB. These values are near or within the typical test-retest variability (∼0.7−1 dB) reported for DIN in normal-hearing listeners, suggesting it may be of limited clinical significance [3, 27]. In particular, for the antiphasic sound presentation higher SNRs (worse performance) were shown for the online compared to onsite tests. One explanation for this effect of platform on antiphasic test outcomes could be the use of different headphones in the onsite and online experiment. However, Potgieter et al. (2016) showed that there were no significant differences in the DIN SRTs when using different types and qualities of headphones [14]. Notably, that study focused on a diotic sound presentation, so these findings may not fully exclude potential headphone interactions in antiphasic sound presentations. Thus, an interaction effect of headphone quality and antiphasic sound presentation cannot be entirely excluded, and future research should investigate this possibility more systematically. In general, one could argue that in the online presentation there is no guarantee of a clean separation between left and right audiosource, which is more critical for antiphasic than for diotic listening. Regarding these findings, in this study, participants used high-quality headphones in the onsite platform, and they mentioned using good quality headphones for the online experiment. Therefore, the observed differences between onsite and online results are likely due to factors other than headphone quality.
An additional factor that could contribute to the difference in scores between the online and onsite outcomes, is the lack of remote calibration in the online experiment. Participants were required to adjust the presentation level to a comfortable level for themselves while listening to digit triplets in masking noise (at 0 dB SNR). Allowing participants to self-adjust unavoidably created variability in the testing conditions, potentially influencing test outcomes. Motlagh Zadeh et al. (2024) underscore that such variability can have a statistically significant impact on test outcomes, suggesting that personal adjustment of sound levels can indeed affect the DIN test scores differently between onsite and online experiments [26]. In our study, participants were asked not to change the level during the whole experiment once set at the start.
Furthermore, the “delete” button was not added to the online version of the DIN test. In the onsite version, participants could use this button to correct mistakes or accidental clicks, whereas in the online version, once a button was pressed, the response was final and could not be undone. Hence, participants could not change their answers in the online session. We did not record the “delete” button usage in the onsite tests. Although participants only mentioned the use of it sporadically, the absence of this option in the online experiment may have contributed to some of the observed differences between onsite and online DIN test scores.
5 Conclusions
This study aimed to investigate the effects of sound presentation, starting SNR, and mixing method on the DIN test scores in participants with normal hearing, onsite and online. We observe that, although the different combinations of the tested parameters did significantly affect DIN test scores, these effects were small. Nevertheless, we must be aware of the distinctions between the diotic and antiphasic sound presentation methods, as well as the instances in which it is necessary to customize your DIN test to the population, in which case either starting SNR or mixing method should be well considered. By understanding and addressing these parameters, researchers and clinicians can continue to refine and improve the validity, reliability, and feasibility of speech audiometry tests, ultimately enhancing the quality of hearing assessment and care.
Acknowledgments
The authors thank Prof. dr. ir. Cas Smits from Amsterdam UMC for making the original Dutch DIN test materials available to us.
Funding
The Turkish Ministry of National Education scholarship, VICI grant (918-17-603) from the Netherlands Organization for Scientific Research (NWO), the Netherlands Organization for Health Research and Development (ZonMw), the Heinsius Houbolt Foundation, a Rosalind Franklin Fellowship.
Conflicts of interest
The authors reported no potential conflicts of interest.
Data availability statement
The research data associated with this article are available in the DataverseNL repository, under the reference https://doi.org/10.34894/PLHRDN.
Ethics approval
The study is part of a larger project, which was approved by the Ethics Committee of the University Medical Center Groningen (METc 2018/427). Participants provided written informed consent and were compensated 8 euros per hour according to departmental guidelines.
Author contribution statement
S.T.: Writing-original draft, writing–review & editing, software, investigation, methodology, visualization, funding acquisition, formal analysis, data curation, conceptualization; T.K.: Writing–review & editing, software, methodology, formal analysis, conceptualization, validation, supervision; G.A.: Writing–review & editing, software, methodology, conceptualization; L.H.: Investigation, writing–review & editing; E.G.: Writing–review & editing, software, methodology, visualization, formal analysis, conceptualization, validation; D.B.: Writing–review & editing, methodology, funding acquisition, conceptualization, supervision.
References
- C. Smits, T.S. Kapteyn, T. Houtgast: Development and validation of an automatic speech-in-noise screening test by telephone. International Journal of Audiology 43 (2004) 15–28 [Google Scholar]
- C. Smits, T. Houtgast: Results from the Dutch speech-in-noise screening test by telephone. Ear and Hearing 26 (2005) 89–95 [Google Scholar]
- C. Smits, S.T. Goverts, J.M. Festen: The digits-in-noise test: assessing auditory speech recognition abilities in noise. Journal of the Acoustical Society of America 133 (2013) 1693–1706 [Google Scholar]
- E. Ozimek, D. Kutzner, A. Sęk, A. Wicher: Development and evaluation of Polish digit triplet test for auditory screening. Speech Communication 51 (2009) 307–316 [Google Scholar]
- S. Jansen, H. Luts, K.C. Wagener, B. Frachet, J. Wouters: The French digit triplet test: a hearing screening tool for speech intelligibility in noise. International Journal of Audiology 49 (2010) 378–387 [Google Scholar]
- C.S. Watson, G.R. Kidd, J.D. Miller, C. Smits, L.E. Humes: Telephone screening tests for functionally impaired hearing: current use in seven countries and development of a US version. Journal of the American Academy of Audiology 23 (2012) 757–767 [Google Scholar]
- M.A. Zokoll, K.C. Wagener, T. Brand, M. Buschermöhle, B. Kollmeier: Internationally comparable screening tests for listening in noise in several European languages: the German digit triplet test as an optimization prototype. International Journal of Audiology 51 (2012) 697–707 [Google Scholar]
- M.W. Kaandorp, C. Smits, P. Merkus, S.T. Goverts, J.M. Festen: Assessing speech recognition abilities with digits in noise in cochlear implant and hearing aid users. International Journal of Audiology 54 (2015) 48–57 [Google Scholar]
- M.W. Kaandorp, C. Smits, P. Merkus, J.M. Festen, S.T. Goverts: Lexical-access ability and cognitive predictors of speech recognition in noise in adult cochlear implant users. Trends in Hearing 21 (2017) 233121651774388 [Google Scholar]
- H.E. Cullington, T. Aidi: Is the digit triplet test an effective and acceptable way to assess speech recognition in adults using cochlear implants in a home environment? Cochlear Implants International 18 (2017) 97–105 [Google Scholar]
- S. Denys, M. Hofmann, H. Luts, C. Guérin, A. Keymeulen, K. Van Hoeck, A. van Wieringen, K. Hoppenbrouwers, J. Wouters: School-age hearing screening based on speech-in-noise perception using the digit triplet test. Ear and Hearing 39 (2018) 1104–1115 [Google Scholar]
- D.R. Moore, H. Whiston, M. Lough, A. Marsden, H. Dillon, K.J. Munro, M.A. Stone: FreeHear: a new sound-field speech-in-babble hearing assessment tool. Trends in Hearing 23 (2019) 233121651987237 [Google Scholar]
- E. Van den Borre, S. Denys, A. van Wieringen, J. Wouters: The digit triplet test: a scoping review. International Journal of Audiology 60 (2021) 946–963 [Google Scholar]
- J.M. Potgieter, D.W. Swanepoel, H.C. Myburgh, T.C. Hopper, C. Smits: Development and validation of a smartphone-based digits-in-noise hearing test in South African English. International Journal of Audiology 55 (2016) 405–411 [Google Scholar]
- M.S.M.G. Vlaming, R.C. MacKinnon, M. Jansen, D.R. Moore: Automated screening for high-frequency hearing loss. Ear and Hearing 35 (2014) 667–679 [Google Scholar]
- T. Dambha, W. Swanepoel, F. Mahomed-Asmail, K.C. De Sousa, M.A. Graham, C. Smits: Improving the efficiency of the digits-in-noise hearing screening test: a comparison between four different test procedures. Journal of Speech, Language, and Hearing Research 65 (2022) 378–391 [Google Scholar]
- K.C. De Sousa, W. Swanepoel, D.R. Moore, H.C. Myburgh, C. Smits: Improving sensitivity of the digits-in-noise test using antiphasic stimuli. Ear and Hearing 41 (2020) 442–450 [Google Scholar]
- J.M. Potgieter, W. Swanepoel, H.C. Myburgh, C. Smits: The South African English smartphone digits-in-noise hearing test: effect of age, hearing loss, and speaking competence. Ear and Hearing 39 (2018) 656–663 [Google Scholar]
- C. Smits, C.S. Watson, G.R. Kidd, D.R. Moore, S.T. Goverts: A comparison between the Dutch and American-English digits-in-noise (DIN) tests in normal-hearing listeners. International Journal of Audiology 55 (2016) 358–365 [Google Scholar]
- N.M. Armstrong, B.C. Oosterloo, P.H. Croll, M.A. Ikram, A. Goedegebure: Discrimination of degrees of auditory performance from the digits-in-noise test based on hearing status. International Journal of Audiology 59 (2020) 897–904 [Google Scholar]
- M.H. Kropp, T. Hocke, P. Agha-Mir-Salim, A. Müller: Evaluation of a synthetic version of the digits-in-noise test and its characteristics in CI recipients. International Journal of Audiology 60 (2021) 507–513 [Google Scholar]
- J. Vroegop, M. Rodenburg-Vlot, A. Goedegebure, A. Doorduin, N. Homans, M. van der Schroeff: The feasibility and reliability of a digits-in-noise test in the clinical follow-up of children with mild to profound hearing loss. Ear and Hearing 42 (2021) 973–981 [Google Scholar]
- A. van Wieringen, S. Magits, T. Francart, J. Wouters: Home-based speech perception monitoring for clinical use with cochlear implant users. Frontiers in Neuroscience 15 (2021) 773427 [Google Scholar]
- W. Swanepoel, K.C. De Sousa, C. Smits, D.R. Moore: Mobile applications to detect hearing impairment: opportunities and challenges. Bulletin of the World Health Organization 97 (2019) 717–718 [Google Scholar]
- Z.E. Peng, S. Waz, E. Buss, Y. Shen, V. Richards, H. Bharadwaj, G.C. Stecker, J.A. Beim, A.K. Bosen, M.D. Braza, A.C. Diedesch: FORUM: remote testing for psychological and physiological acoustics. Journal of the Acoustical Society of America 151 (2022) 3116–3128 [Google Scholar]
- L. Motlagh Zadeh, V. Brennan, D.W. Swanepoel, L. Lin, D.R. Moore: Remote self-report and speech-in-noise measures predict clinical audiometric thresholds. International Journal of Audiology (2024) 1–9 [Google Scholar]
- C. Smits, P. Merkus, T. Houtgast: How we do it: the Dutch functional hearing-screening tests by telephone and internet. Clinical Otolaryngology 31 (2006) 436–440 [Google Scholar]
- J. Chee, R.H. Eikelboom, C. Smits, D.W. Swanepoel, S.L. Wee, T.P. Ng, R.L. Heywood: Digits in noise testing in a multilingual sample of Asian adults. International Journal of Audiology 63, 4 (2024) 269–274 [Google Scholar]
- C. Smits, T. Houtgast: Measurements and calculations on the simple up-down adaptive procedure for speech-in-noise tests. Journal of the Acoustical Society of America 120 (2006) 1608–1621 [Google Scholar]
- S. Türüdü, T. Koelewijn, E. Gaudrain, G. Araiza-Illan, L. Rachman, D. Başkent: An open generic specification for the digits-in-noise test, in: The 13th Speech in Noise Workshop, 2022 [Google Scholar]
- J.R. De Leeuw, R.A. Gilbert, B. Luchterhandt: jsPsych: enabling an open-source collaborative ecosystem of behavioral experiments. Journal of Open Source Software 8 (2023) 5351 [Google Scholar]
- R Core Team: R: A Language and Environment for Statistical Computing. R Foundation for Statistical Computing, Vienna (2020) [Google Scholar]
- S. Holm: A simple sequentially rejective multiple test procedure. Scandinavian Journal of Statistics 6 (1979) 65–70 [Google Scholar]
- K.C. De Sousa, C. Smits, D.R. Moore, H.C. Myburgh, W. Swanepoel: Diotic and antiphasic digits-in-noise testing as a hearing screening and triage tool to classify type of hearing loss. Ear and Hearing 43 (2022) 1037–1048 [Google Scholar]
- J.C. Ceccato, M.J. Duran, W. Swanepoel, C. Smits, K.C. De Sousa, L. Gledhill, F. Venail, J.L. Puel: French version of the antiphasic digits-in-noise test for smartphone hearing screening. Frontiers in Public Health 9 (2021) 725080 [Google Scholar]
- T. Baer, B.C.J. Moore: Effects of spectral smearing on the intelligibility of sentences in noise. Journal of the Acoustical Society of America 94 (1993) 1229–1241 [Google Scholar]
- D. Başkent: Speech recognition in normal hearing and sensorineural hearing loss as a function of the number of spectral channels. Journal of the Acoustical Society of America 120 (2006) 2908–2925 [Google Scholar]
Cite this article as: Türüdü S. Koelewijn T. Araiza-Illan G. Hoogeveen L. Gaudrain E. & Başkent D. 2025. Digits-in-Noise test implementations for onsite and online testing with normal-hearing adults. Acta Acustica, 9, 47. https://doi.org/10.1051/aacus/2025032.
All Tables
Pairwise comparison of mixing methods for the two starting SNRs, in the onsite, antiphasic presentation condition.
Direct comparison of sound presentation, starting SNR, and mixing method parameters between onsite and online platforms as within-subject factors.
All Figures
|
Figure 1. The interface of the onsite (left panel) and online (right panel) versions of the DIN test. |
| In the text | |
|
Figure 2. The onsite DIN test scores (dB SNR) for sound presentation (shown on the left and right sides for diotic and antiphasic, respectively), starting SNR (shown in the white or gray shade for low and high, respectively), and mixing method (shown in green, blue, and red colors for fixed-speech, fixed-noise, and fixed-level, respectively). The boxplots show the lower and upper quartiles and the lines show the median scores of participants. The dots represent outliers, and the whiskers indicate the lowest and highest data points within plus or minus 1.5 times the interquartile range. |
| In the text | |
|
Figure 3. The onsite (left panel) and online (right panel) DIN test scores (dB SNR) for sound presentation (shown on the left and right sides of panels for diotic and antiphasic, respectively), starting SNR (low, high), and mixing method (fixed-speech, fixed-noise, and fixed-level). The boxplots show the lower and upper quartiles and the lines show the median scores of participants (N=22). The dots represent outliers, and the whiskers indicate the lowest and highest data points within plus or minus 1.5 times the interquartile range. |
| In the text | |
|
Figure 4. Average adaptive tracks showing SNR as a function of trial number, for a starting SNR of 0 dB (top) and −16 dB (bottom) and for diotic (light, yellow) and antiphasic (dark, purple). The trials are numbered such that 1 (marked with a vertical line) corresponds to the first adaptive trial when the first trial is repeated until correct (bottom). The horizontal line shows the average over the last 21 trials. |
| In the text | |
Current usage metrics show cumulative count of Article Views (full-text article views including HTML views, PDF and ePub downloads, according to the available data) and Abstracts Views on Vision4Press platform.
Data correspond to usage on the plateform after 2015. The current usage metrics is available 48-96 hours after online publication and is updated daily on week days.
Initial download of the metrics may take a while.