Open Access
Figure 2.
Download original image
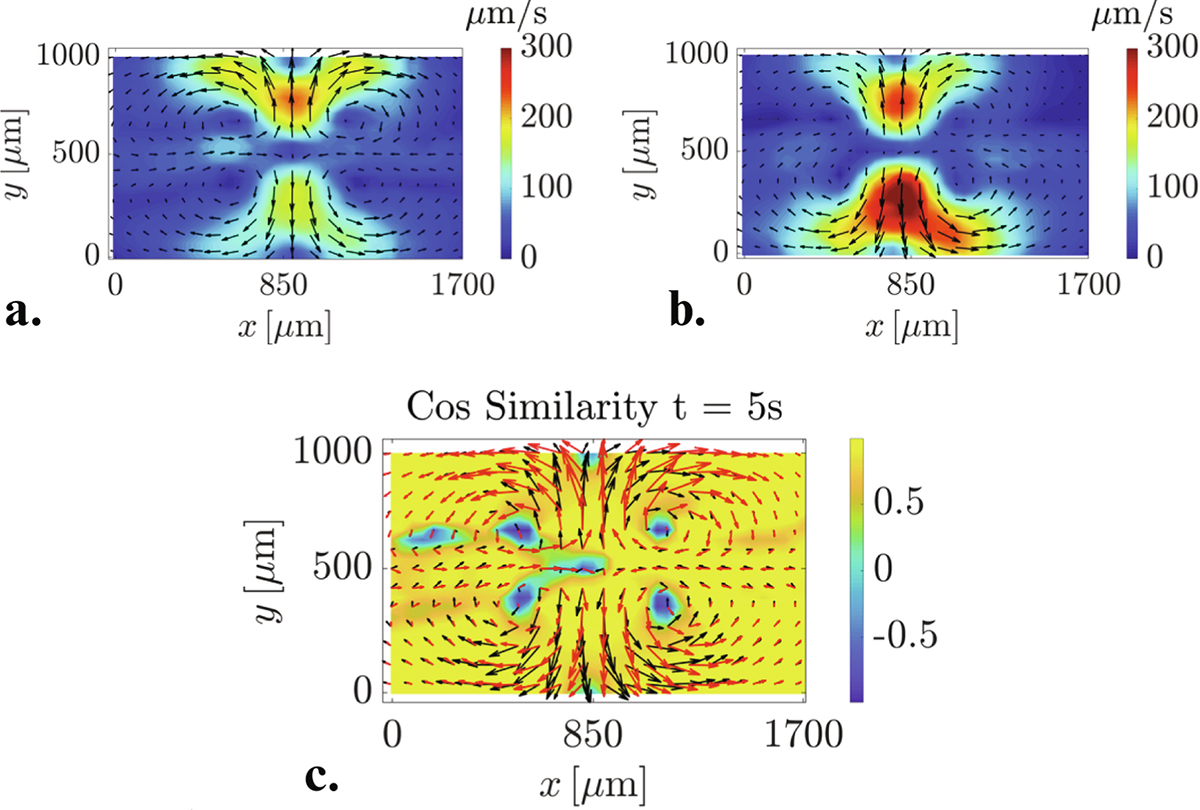
(a) and (b) Velocity fields, obtained from PIV treatment, of two experiments in a continuous configuration for C1000/200 at the same time step t = 5 s where the color map represents the velocity amplitude. (c) The relative S c distribution with the velocity field.
Current usage metrics show cumulative count of Article Views (full-text article views including HTML views, PDF and ePub downloads, according to the available data) and Abstracts Views on Vision4Press platform.
Data correspond to usage on the plateform after 2015. The current usage metrics is available 48-96 hours after online publication and is updated daily on week days.
Initial download of the metrics may take a while.