Figure 4.
Download original image
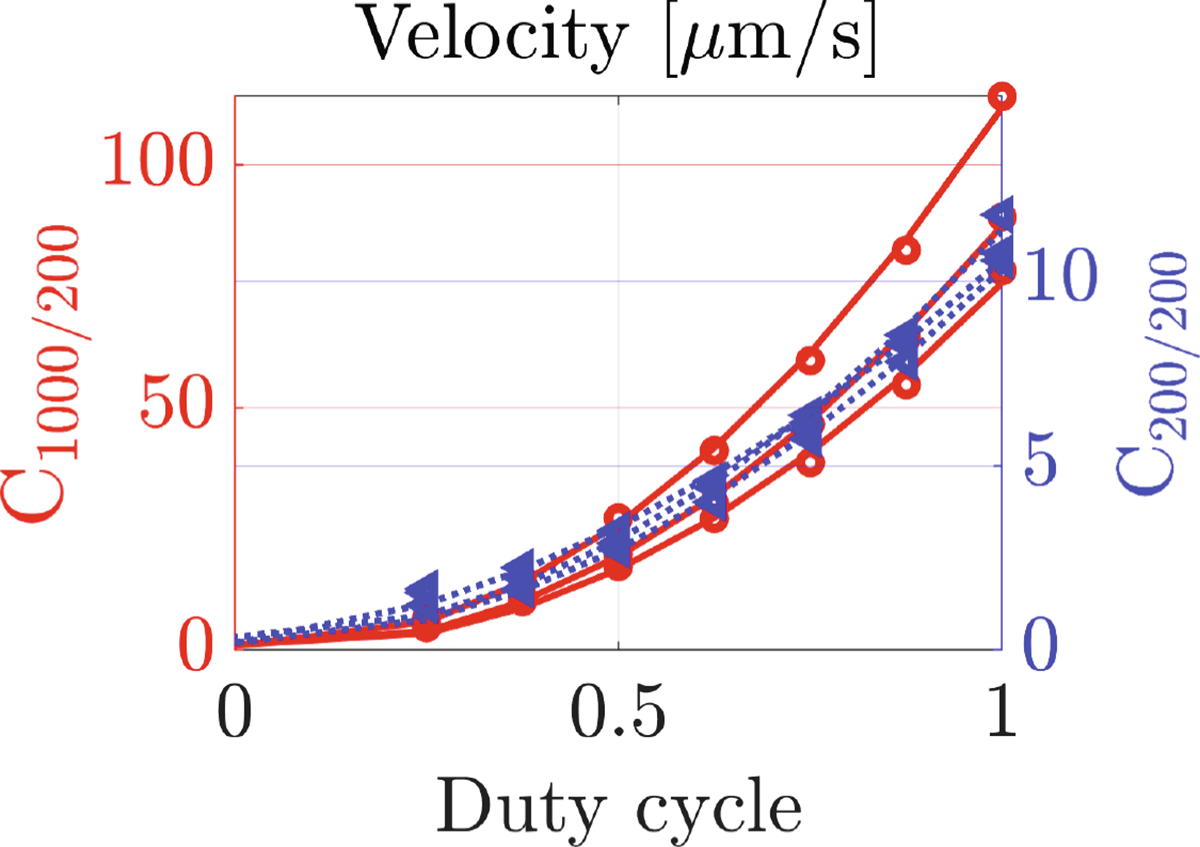
Average velocities for a defined time step t = 5 s, the lines represent the quadratic fitting of the data. Each group of three lines in the red and blue curves corresponds to independent repetitions of the same experimental condition. This approach highlights the reproducibility of the measurements and the reliability of the observed trends.
Current usage metrics show cumulative count of Article Views (full-text article views including HTML views, PDF and ePub downloads, according to the available data) and Abstracts Views on Vision4Press platform.
Data correspond to usage on the plateform after 2015. The current usage metrics is available 48-96 hours after online publication and is updated daily on week days.
Initial download of the metrics may take a while.