Open Access
Figure 3.
Download original image
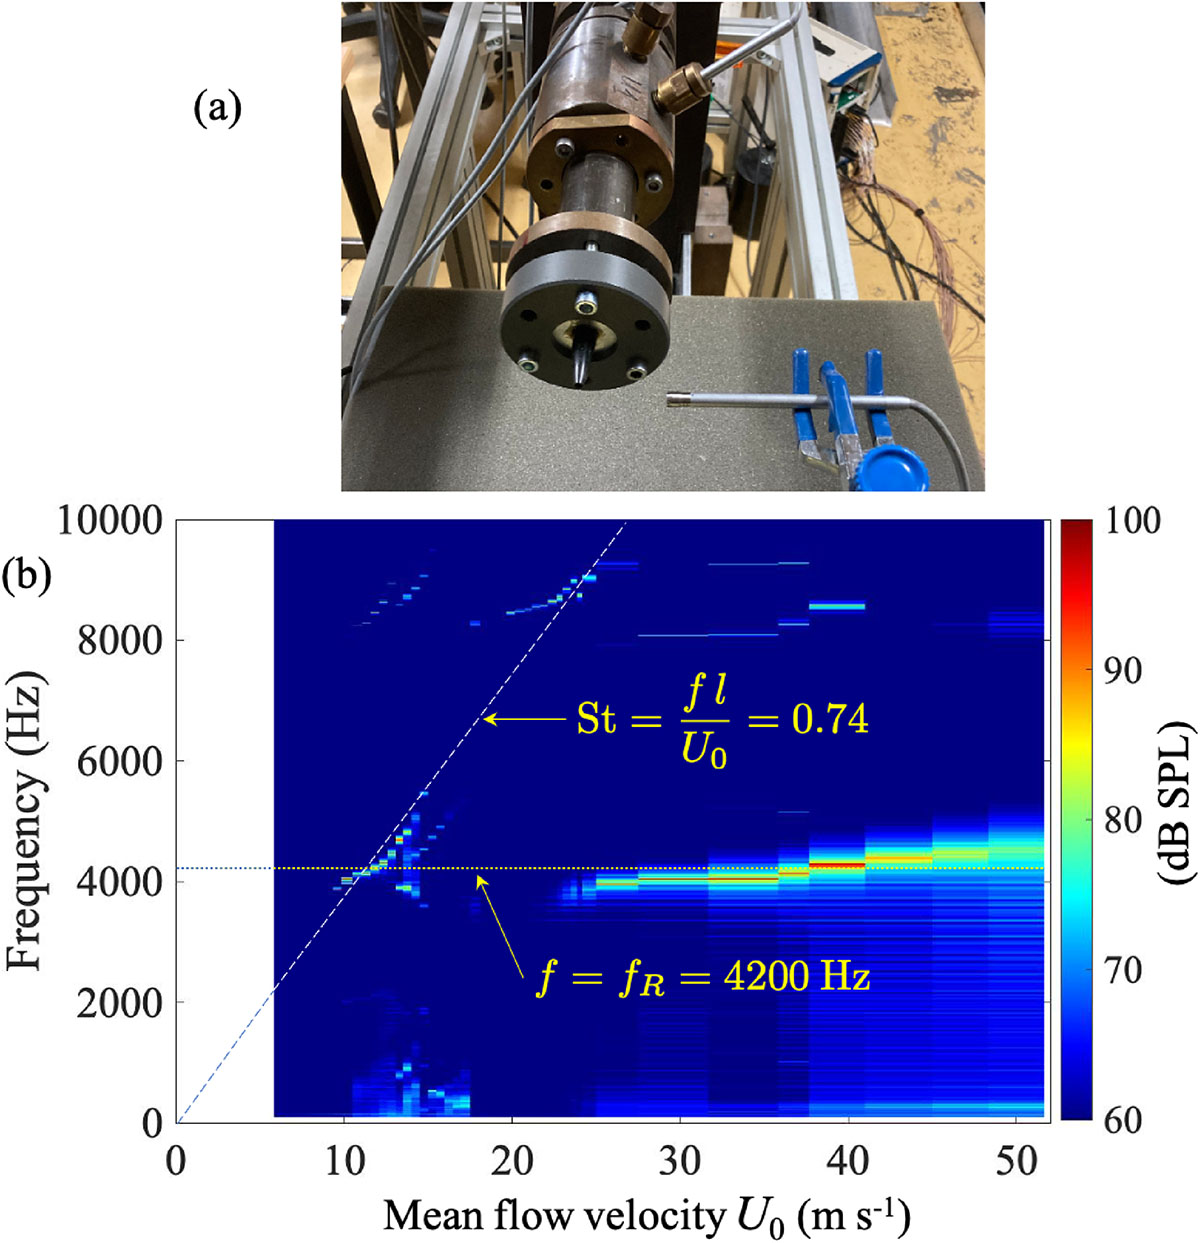
(a) Photograph of the experimental setup. (b) Spectrogram of the emitted sound as a function of the mean flow velocity U0. The dotted line corresponds to first resonance frequency fR = 4200 Hz. The dashed line corresponds to a constant Strouhal number St = 0.74.
Current usage metrics show cumulative count of Article Views (full-text article views including HTML views, PDF and ePub downloads, according to the available data) and Abstracts Views on Vision4Press platform.
Data correspond to usage on the plateform after 2015. The current usage metrics is available 48-96 hours after online publication and is updated daily on week days.
Initial download of the metrics may take a while.