Figure 4.
Download original image
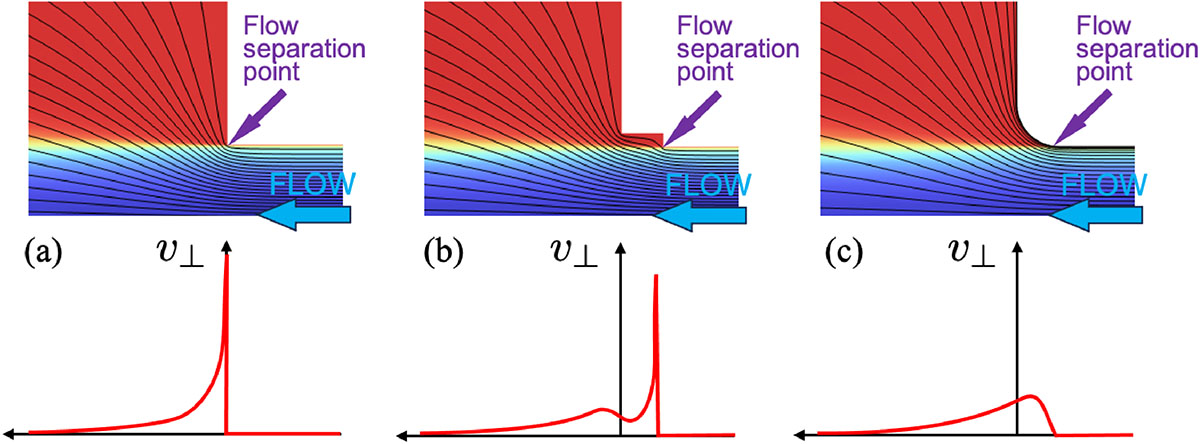
In the top row of figures, the background color represents the mean axial velocity, computed using RANS simulations, while the streamlines correspond to the acoustic velocity field calculated assuming an inviscid fluid. The bottom row shows the component of the acoustic velocity normal to the jet (i.e., radial velocity). These plots are presented for three geometries: (a) a straight pipe, (b) a pipe with an expansion, and (c) a pipe with a rounded outlet.
Current usage metrics show cumulative count of Article Views (full-text article views including HTML views, PDF and ePub downloads, according to the available data) and Abstracts Views on Vision4Press platform.
Data correspond to usage on the plateform after 2015. The current usage metrics is available 48-96 hours after online publication and is updated daily on week days.
Initial download of the metrics may take a while.