


| Issue |
Acta Acust.
Volume 10, 2026
|
|
|---|---|---|
| Article Number | 60 | |
| Number of page(s) | 15 | |
| Section | Structural Acoustics and Vibroacoustics | |
| DOI | https://doi.org/10.1051/aacus/2026054 | |
| Published online | 14 July 2026 | |
Scientific Article
Semi-analytical Timoshenko beam model for symmetrical 1D acoustic black holes: Efficient quantification of the influence of geometric model parameters on vibration behaviour
Institute for Acoustics and Dynamics, Technische Universität Braunschweig, Langer Kamp 19, Brunswick 38106, Germany
* Corresponding author: This email address is being protected from spambots. You need JavaScript enabled to view it.
Received:
20
August
2025
Accepted:
3
June
2026
Abstract
Acoustic black holes (ABH) are a promising measure for improving the vibration behaviour of lightweight structures. Their potential can be further exploited through additive manufacturing (AM), which allows for greater design freedom and multi-material designs compared to conventional processes. In order to fully exploit the potential of AM for ABH structures, a clear understanding of the interactions between process parameters, geometric parameters, mechanical variables and vibration behaviour is required. Global sensitivity analyses (GSA) combined with ABH models enable the precise identification and quantification of these fundamental relationships. However, sample-based GSA approaches require a large number of model evaluations, which leads to very high computational costs when numerical methods such as the finite element method (FEM) are used. This contribution therefore presents a semi-analytical 1D ABH model based on Timoshenko’s beam theory, which enables efficient and comprehensive global sensitivity analyses. The ABH area is divided into discrete beam elements with effective geometric and material-specific properties due to the multi-material design. Numerical validation of the model using FEM shows that the vibration behaviour can be predicted with sufficient accuracy over a wide frequency range. Based on this, a global sensitivity analysis was also carried out to determine the influence of geometric parameters on the vibration behaviour, revealing largely non-additive, clearly non-linear behaviour with pronounced interaction effects. In summary the proposed modelling approach offers considerable potential for further investigation of various fundamental relationships between additively manufactured ABH structures and vibration properties compared to numerical methods.
Key words: acoustic black hole / Timoshenko beam theory / sensitivity analysis
© The Author(s), Published by EDP Sciences, 2026
 This is an Open Access article distributed under the terms of the Creative Commons Attribution License (https://creativecommons.org/licenses/by/4.0), which permits unrestricted use, distribution, and reproduction in any medium, provided the original work is properly cited.
1 Introduction
The reduction of structure-borne noise is playing an increasingly important role in the development of technical lightweight structures, as these can have comparatively poorer acoustic properties due to their high specific stiffness. Undesirable vibrations can not only impair the comfort and safety of mobile systems or the precision of production machines, but can also be a potential source of noise associated with health problems [1, 2].
Acoustic black holes (ABH) are a promising measure for lightweight structures, as they can significantly improve the acoustic behaviour with the same or even reduced mass. The ABH principle is based on a local topology change which, in combination with highly damping materials, creates an impedance gradient (see Fig. 1). This impedance gradient ensures that the phase velocity of an incoming bending wave is slowed down and the wave energy is concentrated in the ABH range. In the idealised case of a completely continuous and smooth transition from a finite to a vanishing thickness, the phase velocity is reduced to zero, whereby reflection of the wave can be excluded. Due to the conservation of energy, the vibration amplitudes and strains increase sharply there, so that the damping materials effectively convert the energy into heat [3]. The conventional realisation of the local continuous impedance change is usually achieved by a thickness change using a power law [3, 4]. For symmetrical ABHs, the change in thickness results in:
 |
Figure 1. Schematic representation of a 1D symmetrical ABH with damping layer on both sides. |
![Mathematical equation: $$ \begin{aligned} h(x) = \left[\frac{{h_0}-h_\mathrm{res} }{L_\mathrm{ABH} ^{p_\mathrm{h} }} x^{p_\mathrm{h} } + h_\mathrm{res} \right],\quad \text{ for}\ x \le L_\mathrm{ABH} \end{aligned} $$](/articles/aacus/full_html/2026/01/aacus250122/aacus250122-eq1.gif) (1)
(1)
where h 0, h res, p h, L ABH denote the thickness, the residual thickness, the power degree and the length of the ABH. Since the damping layer (DL) is constant in the ABH range, the total thickness is h(x)+2h DL, where h DL is the thickness of the damping layer (see Fig. 1).
Since the stiffness depends on the material and the topology, the local impedance change can be adapted by material variations even with a constant beam thickness. Cheer and Daley [5] and Austin et al. [6] show the potential of such multi-material ABHs in numerical studies. The combination of multi-material ABHs and conventional geometric ABHs is demonstrated numerically and experimentally by Huang et al. [7] using additively manufactured samples. Kim and Lee [8] have also emphasised the use of additive manufacturing and presented an interesting helix ABH structure. The local stiffness change of this structure is based on the continuously changing surface moment of inertia. In addition, Zheng et al. [9] numerically demonstrate the ABH effect using an axially functionally graded porous beam structure, the realisation of which can be implemented almost exclusively using additive manufacturing processes. These investigations show that additively manufactured ABH structures are superior to conventionally manufactured components due to their greater design freedom and multi-material capability. The targeted design of robust, additively manufactured ABH structures is possible once the interactions between process parameters, geometric parameters, mechanical quantities and acoustic behaviour have been identified. The necessity of considering the process parameters on the acoustic properties is shown, for example, by the works of Rote et al. [10, 11]. They show that the frequency-dependent flexural modulus (viscoelastic material properties) of additively manufactured structures depends on the number of layers [10, 11]. In addition, several publications [12–14] based on (quasi-) static test methods show that the process parameters have a noticeable influence on the mechanical properties of additively manufactured samples.
Global sensitivity analyses can be used to understand and quantify the influence of mechanical, geometric and process-specific parameters on the vibration properties of additively manufactured 1D ABH structures. However, since such sample-based methods require a large number of model calls, there is an increasing need for efficient simulation models in this context, where an analytical solution of the acoustic behaviour of 1D ABH structures seems most appropriate. The current state of the art shows that the analytical modeling of 1D ABH structures remains a subject of scientific research [15–18]. Lee and Jeon [15] present an analytical solution of the Euler–Bernoulli beam theory for ABHs without damping layers. Li and Ding [16] present a semi-analytical discretisation approach based on the transfer matrix method (TMM) in combination with the Euler–Bernoulli theory for an asymmetric ABH model. Zhen and Tang [18] apply this modelling approach to symmetric ABH models with attenuation layers.
In contrast to Euler–Bernoulli theory, Sørensen et al. [17] use the Timoshenko theory to analytically describe the wave number as a function of the ABH shape and thus determine the optimal ABH profile as part of a geometric optimisation. However, this approach is not suitable for this paper to determine the holistic dynamic behaviour under harmonic excitation. Furthermore, this approach does not sufficiently take into account the influence of the damping layer, as the density and the modulus of elasticity of the damping layer are not fully considered. In addition to the purely analytical descriptions, there are nevertheless notable contributions in which the modelling approach is based on the Timoshenko beam theory. For example, Yu et al. [19] use the Timoshenko beam theory in combination with the isogeometric method to analyse the structural intensity and power flow of ABH laminate beams. In addition, Deng et al. [20] use the Gaussian expansion method in the framework of Timoshenko beam theory and the null space method to model an alternative approach for additive ABHs periodically attached to a load-bearing structure. The attenuation effects of the damping layer are taken into account within the potential energy of the Hamiltonian functional, following Tang et al. [21].
Against this background, the aim of this article is to present a precise analytical model to describe the dynamic behaviour of damped 1D ABH structures under one-sided harmonic force excitation. This model should enable efficient simulation studies to systematically investigate the fundamental relationships between process parameters, geometry, mechanical parameters and vibration behaviour. For this purpose, a one-dimensional ABH model with integrated damping layers based on the Timoshenko beam theory is presented. The choice of this theory is justified by the fact that the Euler–Bernoulli theory leads to an insufficient representation of the vibration behaviour due to the neglect of shear deformations and rotational inertia effects, especially for larger cross-sections and high mode densities [22]. In order to prove the necessity of such a model for extensive sensitivity studies, a comprehensive global sensitivity analysis is carried out with this model to quantify the influence of the geometric ABH parameters on the vibration behaviour. The Sobol sensitivity analysis is used for this purpose because, in contrast to screening methods such as the Morris method, it does not only capture the direct effects of individual parameters, but also identifies higher-order interaction effects [23].
The paper is structured as follows: Section 2 presents the fundamental equations and the resulting semi-analytical ABH-model. It also introduces the numerical finite element model used for validation, as well as the information required for the sensitivity analysis. The subsequent Section 3 discusses the results of the validation process and provides an overview of the sensitive geometric parameters and their interaction effects. Finally, Section 4 summarises the findings and outlines directions for future research.
2 Methods
In this section, the semi-analytical ABH model is presented, starting with the basic theory of forced oscillations of a Timoshenko beam. The numerical reference model for validation, which is based on the finite element method (FEM), is then presented. Finally, the fundamentals of Sobol sensitivity analysis – a global sensitivity analysis method – are explained, and the parameter space used is defined to investigate the influence of geometric variables on the vibration behaviour.
2.1 Symmetric ABH model
2.1.1 Forced Timoshenko beam oscillation theory
The derivation of the beam theory in this subsection is limited to the essential steps for this paper; detailed derivations can be found, for example, in [22, 24].
Assuming that the stationary dynamic excitation force acts exclusively on one of the edges of the beam, the vibration behaviour can be described by the solutions of the homogeneous differential equations in combination with inhomogeneous boundary conditions [22]. The solutions differ in that the wave numbers are predetermined in the vibration-excited system [22].
Based on the coupled partial differential equations (PDE) of the motion of a homogeneous Timoshenko beam with constant cross-section, a set of coupled ordinary differential equations (ODE) is obtained using the separation approach for translational motion w(x, t)=W(x) q(t) and rotational motion ψ(x, t)=Ψ(x) q(t). By suitably combining the ODEs, a homogeneous differential equation of the fourth order is obtained for the pure translational motion
![Mathematical equation: $$ \begin{aligned} \frac{\mathrm{d} ^4W}{\mathrm{d} x^4} +\left[1+\frac{E}{G\,\kappa }\right]\frac{\omega ^2\rho }{E}\,\frac{\mathrm{d} ^2W}{\mathrm{d} x^2} +\left[\frac{\omega ^2\rho }{G\,\kappa }-\frac{A}{I}\right]\frac{\omega ^2\rho }{E}\,W =0, \end{aligned} $$](/articles/aacus/full_html/2026/01/aacus250122/aacus250122-eq2.gif) (2)
(2)
which is decoupled from the rotation Ψ(x) and has a unique, closed solution. The variables ω, ρ, E, G denote the angular frequency, the density, the Young’s modulus and the shear modulus. The geometry parameters A, I, κ denote the cross-sectional area, the area moment of inertia and the shear correction factor. The area moment of inertia I for a rectangular cross-section is defined as bh3/12, with b the width and h the height of the cross-section. The shear correction factor for rectangular cross-sections is given in this paper by the ratio 10(1 + ν)/(12 + 11ν), where ν is Poisson’s ratio [25, 26].
The solution for the translational displacement is obtained by applying an exponential approach

in equation (2), which leads to the following biquadratic equation [24]:
 (3)
(3)
with the abbreviations

By transforming equation (3) into a quadratic equation and subsequent re-substitution, the following four solutions of the biquadratic problem are obtained:
 (4)
(4)
The homogeneous solutions for the displacement result from the separation approach  or the rotation
  on the one hand as a superposition of the four individual solutions
  of the respective exponential approach

on the other hand from the time-dependent expression q(t). However, if there is a stationary harmonic excitation  , the time expression
  can be assumed for the forced oscillation. The solution of the exponential approach of the free oscillation differs only in that the excitation angular frequency Ω determines the wave numbers; defined in the following as
  . This leads to the following solutions of the equations of motion:
 (5)
(5)
For each frequency step, the unknown parameters  and Ŵj are determined using four required boundary conditions. However, since the coupled PDEs allow two motions (see Eqs. (5) and (6)), this, in combination with the boundary conditions, leads to an asymmetric linear system of equations that cannot be solved directly [27]. By comparing variables, the unknown parameter
  can be described as an expression of Ŵj, where
 (6)
(6)
which then results in a symmetrical system of equation [27].
2.1.2 Mechanical formulation of the ABH model
The stationary dynamic behaviour of the semi-analytical ABH model is based on the theory of forced vibration of Timoshenko beams. The symmetrical one-dimensional ABH is discretised into a selected number of beam elements (see Fig. 2), effective and homogenised properties are determined and then assigned to the individual elements. By coupling the individual sections, the overall vibration behaviour of the ABH system under unilateral excitation can be efficiently determined. In addition, this modelling approach also offers the possibility of realistically mapping the ABH range of additively manufactured structures as a function of the layer thickness.
 |
Figure 2. Schematic representation of the discretised semi-analytical ABH model. |
Based on the continuous ABH structure, the system is divided into n beam elements; n − 1 elements resolve the ABH area and the nth element corresponds to the area outside the ABH range (see Fig. 2). Each of these sections is also assigned its own local coordinate system (0 ≤ x
i
≤ l
i
;  ).
).
Since the structure in the ABH section has a continuous change in thickness on the one hand and a multi-material selection on the other, the effective material and geometry parameters for the discretised beam sections must be determined. The effective thickness is calculated by mapping the volume of the discretised ABH section to a volume of constant height and length. Under the assumption, that the ABH shape is described by power function (see Eq. (1)), the effective thickness can be determined by
 (7)
(7)
with i = 1, …, n − 1 and  . The effective cross-sectional area A
i
as well as the effective density ρ
i
are determined from the effective thicknesses h
i
. A mass comparison of the sub-element and the two known densities of the basis material and damping material results in the effective density
. The effective cross-sectional area A
i
as well as the effective density ρ
i
are determined from the effective thicknesses h
i
. A mass comparison of the sub-element and the two known densities of the basis material and damping material results in the effective density
 (8)
(8)
where ρ and ρ DL denote the density of the base material and the density of the damping layer material, respectively. Furthermore, the effective bending modulus E i is determined by comparing the bending moments, thereby reducing the layer structure to a single material. Assuming that both systems have identical bending moments, the effective bending modulus E i can be calculated as follows:
 (9)
(9)
 (10)
(10)
![Mathematical equation: $$ \begin{aligned}&E_i = \left[(E_{\mathrm{DL} }-E)\left( \frac{3}{2}h_i^2 h_{\mathrm{DL} } -3 h_ih_{\mathrm{DL} }^2 + 2h_{\mathrm{DL} }^3\right) \right.\nonumber \\&\qquad + \left. E\frac{h_i^3}{4} \right]\frac{4}{h_i^3}\cdot \end{aligned} $$](/articles/aacus/full_html/2026/01/aacus250122/aacus250122-eq28.gif) (11)
(11)
Based on these geometric and material-specific parameters, the translational motion w
i
(x
i
, t) (see Eq. (5)) can be described for each section as a function of the excitation angular frequency Ω, taking into account the respective specific wave numbers  (see Eq. (4)).
The unknown parameters from equation (5) are determined by the geometric compatibility and equilibrium conditions of the sub-elements and from the boundary conditions of the overall system, taking into account the variable expression from equation (7). The overall system considered in this article corresponds to that of a freely supported beam that is excited by a load at the end of the beam, which is located on the other side of the ABH (see Fig. 2). This results in the following four boundary conditions of the overall system, which are assigned proportionally to the 1st and nth element:
 (12)
(12)
 (13)
(13)
 (14)
(14)
 (15)
(15)
the parameter  corresponds to the force amplitude. Equations (13) and (14) describe that the ABH system has a vanishing moment at the edges of the overall system (x
1 = 0, x
n
= l
n
). Equations (15) and (16) describe that the shear force disappears at the edge of the ABH, while it corresponds to the excitation force
corresponds to the force amplitude. Equations (13) and (14) describe that the ABH system has a vanishing moment at the edges of the overall system (x
1 = 0, x
n
= l
n
). Equations (15) and (16) describe that the shear force disappears at the edge of the ABH, while it corresponds to the excitation force  on the opposite side x
n
= l
n
(see Fig. 2). The boundary conditions at the connection of the sub-elements, the geometric compatibility and the internal moments and forces, can be described as follows:
on the opposite side x
n
= l
n
(see Fig. 2). The boundary conditions at the connection of the sub-elements, the geometric compatibility and the internal moments and forces, can be described as follows:
 (16)
(16)
 (17)
(17)
 (18)
(18)
 (19)
(19)
with i = 1, 2, …, n − 1. While equations (17) and (18) ensure that the translational displacements and rotations at the element transitions are identical, equations (19) and (20) specify that the forces and moments at the boundaries are equal.
Using the basic equations for each section (Eqs. (5) and (6)), the effective parameters, the variable compatibility condition (Eq. (7)) and the boundary conditions (Eqs. (13)–(20)), this results in a large, complex, inhomogeneous linear system of equations with the dimension  (see Appendix A). Since the matrix is only sparsely distributed along the main diagonal (see Fig. B.1 in Appendix B), a sparse solver (spsolve) from the Python library SciPy [28] is used to efficiently solve the still unknown parameters of each element (see Eq. (5)).
Since this model was developed to represent the vibration behaviour of additively manufactured ABH structures, the viscoelastic properties are taken into account under the assumption of harmonic force excitation by a complex modulus  [27, 29]. The real part is proportional to the maximum energy stored over one load cycle and the imaginary part is proportional to the energy dissipation over one period [29]. This simple modelling approach allows the dissipative behaviour of plastics to be taken into account. In the model presented, all equations that contain a Young’s modulus are replaced by a complex Young’s modulus: The modulus E becomes
  and EDL becomes
  . All variables that depend directly or indirectly on these complex material parameters also automatically become complex-valued.
For the following studies, the vibration behaviour is considered exclusively in the frequency domain using the Fourier transformation.
2.2 Validation framework and Finite element model
To validate the semi-analytical approach, an arbitrary ABH geometry is defined and the local steady-state dynamic frequency response at the end of the ABH range (see Fig. 3) is calculated and compared both with the analytical method presented and with the finite element method (FEM) using the commercial software Abaqus2025 (Dassault Systémes, Vélizy-Villacoublay, France). In order to minimise the computational effort, a numerical 2D model is selected, as the excitation and the measuring point lie in the symmetry plane and therefore no torsional vibrations are to be expected.
 |
Figure 3. Schematic representation of the simulation model of a linear symmetric 1D ABH, meshed with CPS8R elements. |
For this purpose, a plane stress element (CPS8R) is selected with a quadratic ansatz function and reduced integration [30]. Since viscoelastic material parameters are assumed, the steady-state dynamic behaviour under a local harmonic excitation of 1 N is calculated using a direct solution analysis [30]. The frequency response considered between 10 Hz and 6000 Hz is resolved with a frequency step size of 1 Hz. A symmetrical ABH beam with dimensions of 200 mm × 10 mm × 4 mm (length × width × thickness) is considered as the basic structure. For the integrated ABH, the length is set to 20% of the beam length, with a power-law exponent of 4 and a residual thickness of 0.4 mm. In addition, damping layers with a thickness of 0.4 mm are applied to both sides. For both modelling approaches – assuming no relaxation transitions in the frequency range under consideration – the following viscoelastic material properties are used for the structural and damping areas, based on [27].
The resolution of the FE model and the associated selected element size depends on the discretisation of the ABH shape and the number of nodes required to resolve the highest existing bending wave. Outside the ABH, the global mesh size depends only on the resolution of the bending wave. In contrast to the FE model, only the area of the ABH needs to be resolved in the semi-analytical approach, as a closed solution exists for ungraded beams. For the geometry resolution, the inverse function of the analytical description of the ABH shape (see Eq. (1)) is discretised linearly with the required number of elements (n − 1). This leads to a shape dependent resolution of the ABH profile depending on its power degree as follows:
![Mathematical equation: $$ \begin{aligned} x_i&= \left[ \frac{i}{n-1} L_\mathrm{ABH} ^{p_\mathrm{h} } \right]^{\frac{1}{p_\mathrm{h} }} ,&\text{ with}\ i = 0,\ldots ,n-1\end{aligned} $$](/articles/aacus/full_html/2026/01/aacus250122/aacus250122-eq46.gif) (20)
(20)
 (21)
(21)
To estimate the global edge length of the CPS8R-elements, an approach is chosen that is based on the determination of the wavelength according to the Euler–Bernoulli beam theory [22]. Since the bending wavelength depends on both the material properties and the thickness, a conservative approach is chosen for the entire structure, in which the smallest occurring bending wave in the overall system defines the edge length of the entire structure. This results in the required element edge length
 (22)
(22)
taking into account the required number of element nodes per bending wavelength n CPS8R, the frequency vector f and the location vector x.
The actual number of elements required per bending wave and the necessary discretisation of the ABH shape function for this geometry were investigated in convergence studies. It was shown that the geometry-based discretisation has no influence on the results of the FEM simulation, as the element size required for the resolution of the bending wave at 6 kHz also adequately represents the geometry. For the validation, 11 nodes per bending wave length (see Fig. C.1 in Appendix C) are selected for the FEM model, which corresponds to a global mesh size of 0.0027 m. Since the residual thickness and the damping layers are thinner than the global element size, the element distribution was controlled in such a way that each material layer is resolved with 5 nodes in the thickness direction. This results in a total of 208 elements with a total number of 3140 variables in the model (1570 degrees of freedom plus 1570 variables of the Lagrange multiplier). In contrast, the ABH domain of the semi-analytical approach is resolved using equations (21) and (22) with 51 elements (see Fig. C.1 in Appendix C), which corresponds to a sparse complex linear system of equations of dimension 204 × 204 (see Fig. B.1 in Appendix B).
2.3 Sobol sensitivity analysis
The term sensitivity analysis refers to various methods for the qualitative or quantitative investigation of model behaviour with uncertain input parameters. This section presents the Sobol method, one of the standard approaches of global sensitivity analysis, to determine the influence of the ABH geometry parameters (model input parameters) on the vibration behaviour of ABHs.
For this purpose, the mean square transfer mobility  of the ABH structure is used, which describes the global vibration behaviour of the structure when excited by a single force [31]. Therefore, the area-averaged quadratic surface velocity – here 100 uniformly distributed structure points – is set in relation to the quadratic excitation amplitude [31]. Since increased vibration amplitudes are to be expected in the ABH range, the mean square transfer mobility is considered exclusively outside this range on a fixed length of two-thirds of the entire beam, starting at the point of force excitation (see Fig. 2). The relevant considered frequency range is between 22 Hz and 5625 Hz with a resolution of 1 Hz. To reduce the amount of information, the frequency-dependent sensitivity variables are evaluated in the octave band spectrum in accordance with DIN EN 61260-1 [32] instead of analysing each individual frequency point. The root mean square value (RMS) is then calculated for each of these frequency bands. Figure 4 shows a comparison of the continuous frequency spectrum and the octave band spectrum of the mean square mobility of the ABH structure selected for validation (see Tab. 1) for the defined frequency range, taking into account the material parameters from Table 2. The reference value for the level is set to hT02 = 1 × 10⁻⁶ m2 s−2 N2.
 |
Figure 4. Comparison of a continuous frequency spectrum and the octave spectrum for the level of the mean square mobility L h T 2 . |
The range of variability of the ABH geometry parameters (input values).
The Sobol sensitivity analysis is a method of the variance decomposition techniques to quantify which individual input parameters or groups of inputs are responsible for the variance of the model output [33]. The model output Y = M(X) of any square integrable function – defined on the unit hypercube [0, 1] d – with respect to independently distributed input parameters X = (X 1, X 2, …, X d ) with an associated PDF, can be represented as a sum of elementary functions as follows [23, 33]:
 (23)
(23)
The determination of the variance of the model output Var(M(X)) leads to a variance decomposition based on the summation scheme of equation (24). The proportions provide information about the order of magnitude in which the input parameters or groups of input parameters best describe the variance of the model output. The ratio of the variance decomposition to the total variance of the model output results in the summation of the so-called Sobol indices
 (24)
(24)
where the Sobol first-order interaction effects are described by ![Mathematical equation: $ S_i = \frac{\mathrm{Var}[\mathbb{E}(Y|X_i)]}{\mathrm{Var}(Y)} $](/articles/aacus/full_html/2026/01/aacus250122/aacus250122-eq52.gif) , second-order Sobol indices by
, second-order Sobol indices by ![Mathematical equation: $ S_{ij} =\frac{\mathrm{Var}[\mathbb{E}(Y|X_i,X_j)]}{\mathrm{Var}(Y)} - S_i - S_j $](/articles/aacus/full_html/2026/01/aacus250122/aacus250122-eq53.gif) and so on for higher-order interaction effects [23]. As the number of input parameters is exponentially related to the number of Sobol indices (2
d
− 1), Iooss and Lemaître [23] propose calculating the Sobol indices up to a maximum order of two; this excludes approaches such as the polynomial chaos expansion. This reduces the computational effort and increases the interpretability of these indices [23]. The total Sobol index can be calculated to describe the overall influence of a particular parameter on the total variance, taking into account all interaction effects with the other parameters
and so on for higher-order interaction effects [23]. As the number of input parameters is exponentially related to the number of Sobol indices (2
d
− 1), Iooss and Lemaître [23] propose calculating the Sobol indices up to a maximum order of two; this excludes approaches such as the polynomial chaos expansion. This reduces the computational effort and increases the interpretability of these indices [23]. The total Sobol index can be calculated to describe the overall influence of a particular parameter on the total variance, taking into account all interaction effects with the other parameters
![Mathematical equation: $$ \begin{aligned} S_{{T_i}} = 1 - \frac{\mathrm{Var} [{\mathbb{E} }(Y|\mathbf X _{- i})]}{\mathrm{Var} (Y)}, \end{aligned} $$](/articles/aacus/full_html/2026/01/aacus250122/aacus250122-eq54.gif) (25)
(25)
where Var[𝔼(Y|X −i )] denotes the total amount of variance not considering the i-th input parameter [34].
The Sobol indices can be interpreted as follows: If the sum of the first-order Sobol indices is equal to 1, the higher-order indices are equal to zero, which means that there are no interaction effects between the input parameters (see Eq. (25)). This means that the total Sobol indices are also equal to the first-order Sobol indices, which also indicates additive model behaviour. It can be shown that models with interaction effects, on the other hand, exhibit non-linear behaviour. In the context of Sobol sensitivity analysis, the term non-linearity means a non-linear dependence of the model on its parameters.
As this contribution examines the influence of the geometric ABH parameters on the overall behaviour of the model, the parameter range is defined using the previously defined nominal values of the ABH structure (see Tab. 1). The parameter range is determined by a deviation of ±50% from these geometric input parameters. As no assumptions are made a priori about probable value ranges, a uniform distribution 𝒰 is assumed.
The material parameters from Table 2 are taken into account for these studies.
Frequency-dependent viscoelastic material properties for structural and damping domains.
For the following studies, the Python library SALib [35, 36] is used to generate the parameter space on the one hand and to determine the first-order and total Sobol indices on the other. Since sample-based approaches for estimating the Sobol indices require a large number of samples, a convergence study is carried out to determine the required sample size (see Fig. 5) [23, 33]. The mean relative error over the eight octave bands  between two sample sizes serves as a measure of convergence. It can be seen that the relative deviation decreases with increasing sample size and finally converges. A sample size of 163 840 model calls is used to estimate the Sobol indices with a good accuracy; for all input parameters, the relative deviations
  are smaller than 1%.
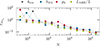 |
Figure 5. Convergence study based on the Sobol total index for the required number of samples. |
3 Results
This section presents the validation of the analytical model using FEM, followed by the sensitivity analysis results.
3.1 Numerical validation of the symmetric ABH model
A comparison of the simulation effort in pure CPU time between the semi-analytical model and the FEM model clearly shows that the semi-analytical model is clearly superior with almost identical dynamic behaviour; Figure 6 shows the frequency responses of the surface velocity, and Figure D.1 in Appendix D shows the phase frequency responses. The calculation time for the entire frequency range of the validation model using the finite element method (Abaqus user time) is approximately 222 s, while the semi-analytical modelling approach requires less than 2.5 s. The calculations were performed using an AMD Ryzen 7 9700X 8-core processor and 32 GB RAM.
 |
Figure 6. Comparison of FEM simulation and semi-analytical approach of the ABH geometry defined for validation; Top: level of surface velocity; Bottom: relative error of resonance points (red) and frequency response assurance criterion for each octave band (blue). |
From a qualitative point of view, both models show a very good agreement, even in the higher frequency range where ABH is effective, as can be seen in the upper part of Figure 6. The calculated levels (reference value v0 = 1 × 10⁻⁹ ms−1) of the frequency responses of the surface velocity of the numerical and semi-analytical approaches are shown there. The lower subplot shows the relative deviation of the resonance frequencies ε f r as well as the agreement between the two frequency responses in the respective octave bands, determined using the Frequency Response Assurance Criterion (FRAC, see Appendix E). A FRAC value of 1 corresponds to complete agreement, a value of 0 to no agreement. The comparison of the resonance frequencies of the two modelling approaches shows that all but one of them have a relative deviation of less than around 0.9%. The criterion for frequency response matching (FRAC) fluctuates just below 1, clearly showing that the frequency responses in the respective octave band are almost identical despite the slight resonance shift between simulation and semi-analytical modelling. Based on these two criteria (ε f r , FRAC), it can be assumed that the sensitivity analyses can be carried out with sufficient accuracy using the semi-analytical model.
To illustrate the ABH effect, Figure 7 shows the difference in dynamic behaviour between the ABH reference beam and a uniform beam with the same geometric dimensions (L, b, h0), only without ABH. The uniform beam also has a symmetrical attenuation layer in the ABH range, which has identical dimensions to those of the ABH beam (see Tab. 1). A look at the levels of the mean square mobility values  makes it clear that the ABH beam reduces the vibrations at high frequencies significantly more than the damped uniform beam.
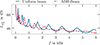 |
Figure 7. Level of the mean square mobility of a uniform beam with damping layer and a beam with integrated ABH. |
3.2 Sensitivity analysis
Figure 8 shows the Sobol sensitivity indices of the first order S i and the total order S T i for the analysed octave bands. The index S i quantifies the proportion of the variance of the model response that can be attributed to a single parameter, while the overall index S T i also includes all effects of interactions with other parameters. A deviation between the two values therefore indicates, for the respective parameter, that there are interactions with other parameters. As the calculation of higher-order interactions requires considerable simulation effort, this article is limited to second-order effects. Figure 9 illustrates these interactions for each octave band using the Sobol coefficient Sij, which quantifies the mutual influences between two parameters.
 |
Figure 8. Estimated Sobol indices for the eight octave bands with 163 840 samples. Top: Sobol index of the first order. Bottom: Sobol index of the total order. |
 |
Figure 9. Interaction maps of the geometric parameters in the specific octave band using the second-order Sobol index S ij . |
The results show that the parameters – with the exception of the first octave band – exhibit pronounced interactions and thus a non-linear model behaviour between the input parameters and the vibration behaviour. In almost all octave bands, it can be seen that the length of the ABH L ABH/L, both independently and in combination with the other geometric variables, has the dominant influence on the vibration behaviour (see Fig. 8). Looking at the first-order Sobol indices (S i ) of the other geometric parameters, it is clear that these have only a minor influence on the vibration behaviour. The total influence (S T i ), however, shows that all geometric parameters – with the exception of the damping layer height h DL – have a significant influence on the vibration behaviour of 1D ABHs, which can be attributed to interaction effects. This is also confirmed by considering the second-order Sobol indices (S ij ), whose influence, however, decreases with increasing frequency, with the exception of the 1000 Hz octave band.
With the defined parameter space (Tab. 1), it can be seen that the strongest pairwise interaction between the ABH length and the power factor p h (see Fig. 9) occurs across all affected frequency bands and that these parameters have a significant influence on the impedance change in the ABH range and thus on the effective range of the ABH. Looking at the independent influence of the power factor on the vibration behaviour of the ABH structure, it can be seen that this has a negligible influence. In addition to the power factor, there are occasionally more pronounced second-order interactions between the length of the ABH and the residual thickness hres.
Looking at the residual thickness and height of the damping layer, it becomes apparent that the sole influence of these variables on the vibration behaviour of the ABH structure is negligible. The influence on the vibration behaviour increases slightly with increasing frequency, as it can be assumed that the ABH tends to become more effective in the higher frequency ranges and that correspondingly larger vibration amplitudes can be expected in the ABH range depending on the thickness. The vibration energy concentrated locally there can be effectively converted into heat, depending on the damping layer. Furthermore, the additional mass of the damping layer also influences the vibration behaviour due to the increasing inertial forces. However, if the overall influence of the two parameters is considered, it becomes apparent that the residual thickness gains significantly in importance due to the second- or higher-order interaction effects described above, e.g. with the length of the ABH. The damping layer, on the other hand, shows that it is largely independent of second- or higher-order interaction effects, as the first-order Sobol index and the total-order Sobol index are almost identical.
As the difference between the total index and the first-order Sobol index in the various octave bands cannot be explained by the second-order Sobol index alone, the geometric parameters must also be involved in higher-order interactions. This is plausible when considering the complex interconnection of the individual parameters in the model.
Since the Sobol indices only provide information about the influence of individual parameters and their interactions on the output variable under consideration, the influence of the geometric parameters on the mean square transfer mobility  is shown as an example for the octave bands at 500 Hz and 2000 Hz in Figure 10. Based on the results of the Sobol sensitivity analysis, the damping layer is no longer taken into account and a constant value of 0.6 mm is assumed. For the octave band at 500 Hz, it can be seen that the value of the mean square transfer mobility is particularly low when the ABH occupies a large proportion of the overall structure and a higher power factor ph is selected. Depending on the selected power factor, this in turn results in an optimum residual thickness to keep the vibration behaviour in the frequency band under consideration as low as possible.
 |
Figure 10. Influence of selected geometric ABH parameters on the vibration behaviour of 1D symmetric ABH structures. |
In the 2000 Hz octave band, a clear range in the parameter space for vibration reduction is comparatively less obvious than in the 500 Hz octave band. Depending on the power factor, however, the vibration behaviour can be reduced to a local minimum if the size and residual thickness are selected accordingly. Nevertheless, clearly lower level values are achieved in the entire parameter space than in the 500 Hz band, which proves the effectiveness of the ABHs. If a local minimum is nevertheless aimed for, this is interestingly achieved with comparatively short ABHs. This shows that the residual thickness must also increase as the power level increases.
4 Summary and conclusions
This paper first presents a semi-analytical model based on Timoshenko beam theory, which is used to efficiently calculate the overall behaviour of one-dimensional symmetrical ABH structures with damping. To this end, the ABH structure is discretised into a finite number of elements, with the effective properties being calculated and assigned to the respective elements. To this end, the effective heights, which are also required to determine the effective material parameters, are first derived using a volume comparison. The effective material parameters of the multi-layer beam (damping layer-beam-damping layer) are then determined on the basis of a comparison of bending moments and masses. A validation with the FE method proves the sufficient accuracy of this approach to predict the holistic vibration behaviour. To analyse the vibration behaviour of 1D ABH structures, a global sensitivity analysis based on the Sobol method is performed to quantify the influence of the geometric ABH parameters. For this analysis, the mean-square transfer mobility is calculated for eight octave bands in a frequency range from 22 Hz to 5625 Hz with a resolution of 1 Hz. The variation of the geometric parameters for the Sobol analysis is based on a variation of previously defined nominal values by ±50%.
The evaluation of the global sensitivity analysis shows that this method is a powerful tool for understanding and quantifying the behaviour of the input parameters on the output variables of the model. In combination with the presented semi-analytical model, the disadvantages of the computationally intensive method can be avoided. Nevertheless, it must be pointed out that the significance of the results is limited to the defined input parameter range and the output variable under consideration. The analysis of the influence of geometric parameters on the vibration behaviour of one-dimensional symmetrically damped ABHs has shown that, with the exception of the length of the ABH, the independent influence of specific geometric variables generally plays a rather minor role in vibration behaviour. The influence of these geometric parameters is evident in second- and higher-order interactions, which corresponds to non-linear model behaviour. Of all the geometric parameters analysed, the damping layer has the least and therefore negligible influence. Using the knowledge gained about the system behaviour, two parameter studies were then carried out as examples to illustrate the influences of the geometric variables on the vibration behaviour with a reduced parameter space.
Since the modelling approach has successfully demonstrated that extensive sensitivity studies can be carried out with minimal simulation effort, the input parameters are to be expanded in further studies to include the design freedom and process parameters of additive manufacturing. This will allow the influences of this manufacturing process on the vibration behaviour of ABH structures to be investigated in depth. To this end, extensive experimental investigations are to be carried out on beam samples in order to map the influence of the process parameters on the viscoelastic material behaviour and thus take this into account in the model.
Funding
Funded by the Deutsche Forschungsgemeinschaft (DFG, German Research Foundation) – project number: https://gepris.dfg.de/gepris/projekt/508318707?language=de.
Conflicts of interest
The authors declare that they have no known competing financial interests or personal relationships that could have appeared to influence the work reported in this paper.
Data availability statement
The research code associated with this article is available on GitHub, under the reference [37].
Author contribution statement
Philipp M. Heck was responsible for designing the study, developing the methodology, programming the software, validating the results and conducting the formal data analysis. He created all visualisations, wrote the original draft of the manuscript, implemented the critical review comments and managed the project administration. Tobias P. Ring contributed to the editing of the manuscript and provided academic supervision. Sabine C. Langer contributed to the review and editing of the manuscript, procured and provided the necessary resources, provided scientific supervision and acquired funding.
References
- J.M. Sinapius, M. Misol: Aktive Schallbeeinflussung. Springer Berlin Heidelberg, Berlin, Heidelberg, 2018, pp. 375–450. [Google Scholar]
- J.M. Sinapius, B.T. Kletz, S. Opitz: Aktive Vibrationskontrolle. Springer Berlin Heidelberg, Berlin, Heidelberg, 2018, pp. 241–350. [Google Scholar]
- M.A. Mironov: Propagation of a flexural wave in a plate whose thickness decreases smoothly to zero in a finite interval. Soviet Physics Acoustics 34 (1987) 318–319. [Google Scholar]
- A. Pelat, F. Gautier, S.C. Conlon, F. Semperlotti: The acoustic black hole: a review of theory and applications. Journal of Sound and Vibration 476 (2020) 115316. https://www.sciencedirect.com/science/article/pii/S0022460X20301474. [Google Scholar]
- J. Cheer, S. Daley: On the potential of a functionally graded acoustic black hole using multi-material additive manufacturing, in INTER-NOISE and NOISE-CON Congress and Conference Proceedings. International Institute of Noise Control Engineering, Seoul, Südkorea, 2020, pp. 5255–5261. [Google Scholar]
- B. Austin, J. Cheer, A. Bastola: Optimisation of a multi-material acoustic black hole, in Proceedings of Internoise 2022. International Institute of Noise Control Engineering, Glasgow, Scotland, 2022, pp. 592–598. [Google Scholar]
- W. Huang, H. Zhang, D.J. Inman, J. Qiu, C.E.S. Cesnik, H.L. Ji: Low reflection effect by 3d printed functionally graded acoustic black holes. Journal of Sound and Vibration 450 (2019) 96–108. https://www.sciencedirect.com/science/article/pii/S0022460X19301518. [Google Scholar]
- S.-Y. Kim, D. Lee: Experimental investigation of a modular helix-acoustic black hole. Applied Acoustics 214 (2023) 109661. https://www.sciencedirect.com/science/article/pii/S0003682X23004590. [Google Scholar]
- W. Zheng, S. He, R. Tang, S. He: Damping enhancement using axially functionally graded porous structure based on acoustic black hole effect. Materials 12, 15 (2019) 2480. https://www.mdpi.com/1996-1944/12/15/2480. [Google Scholar]
- S. Rothe, C. Blech, S.C. Langer, H. Watschke, T. Vietor: Layer-effect by additive manufacturing of acoustic black holes, in: INTER-NOISE and NOISE-CON Congress and Conference Proceedings. Institute of Noise Control Engineering, Madrid, Spain, 2019, pp. 4773–4781. [Google Scholar]
- S. Rothe, C. Blech, H. Watschke, T. Vietor, S.C. Langer: Material parameter identification for acoustic simulation of additively manufactured structures. Materials 14, 1 (2021) 168. https://www.mdpi.com/1996-1944/14/1/168. [Google Scholar]
- J. Giri, A. Chiwande, Y. Gupta, C. Mahatme, P. Giri: Effect of process parameters on mechanical properties of 3d printed samples using FDM process. Materials Today: Proceedings 47 (2021) 5856–5861. https://www.sciencedirect.com/science/article/pii/S221478532103203X. [Google Scholar]
- A. Molina, J. Acosta-Sullcahuamán: Effect of the process parameters on the mechanical properties of 3d-printed specimens fabricated by material extrusion 3d printing. Engineering Proceedings 83, 1 (2025) 1. https://www.mdpi.com/2673-4591/83/1/1. [Google Scholar]
- A.A. Shileyko, A.A. Kutin, V.V. Pirogov: Influence of 3d printing process parameters on mechanical properties of ABS plastic samples fabricated by material extrusion. Russian Engineering Research 44, 7 (2024) 975–983. [Google Scholar]
- J.Y. Lee, W. Jeon: Exact solution of Euler–Bernoulli equation for acoustic black holes via generalized hypergeometric differential equation. Journal of Sound and Vibration 452 (2019) 191–204. https://www.sciencedirect.com/science/article/pii/S0022460X19301075. [Google Scholar]
- X. Li, Q. Ding: Analysis on vibration energy concentration of the one-dimensional wedge-shaped acoustic black hole structure. Journal of Intelligent Material Systems and Structures 29, 10 (2018) 2137–2148. [Google Scholar]
- K.S. Sørensen, H.D. Cornean, S. Sorokin: Optimal profile design for acoustic black holes using Timoshenko beam theory. The Journal of the Acoustical Society of America 153, 3 (2023) 1554–1563. [Google Scholar]
- Y. Zhen, T. Gu, Y. Tang: Vibration control and energy accumulation of one-dimensional acoustic black hole structure with damping layer. Archive of Applied Mechanics 92, 6 (2022) 1777–1788. [Google Scholar]
- W. Yu, Y. Zhao, M. Chen, G. Jin: Energy dissipation and power flow analysis based on acoustic black hole laminated beams. Thin-Walled Structures 205 (2024) 112503. https://www.sciencedirect.com/science/article/pii/S0263823124009443. [Google Scholar]
- J. Deng, J. Ma, X. Chen, Y. Yang, N. Gao, J. Liu: Vibration damping by periodic additive acoustic black holes. Journal of Sound and Vibration 574 (2024) 118235. https://www.sciencedirect.com/science/article/pii/S0022460X23006843. [Google Scholar]
- L. Tang, L. Cheng, H. Ji, J. Qiu: Characterization of acoustic black hole effect using a one-dimensional fully-coupled and wavelet decomposed semi-analytical model. Journal of Sound and Vibration 374 (2016) 172–184. https://www.sciencedirect.com/science/article/pii/S0022460X16300062. [Google Scholar]
- D. Gross, W. Hauger, P. Wriggers: Schwingungen kontinuierlicher Systeme. Springer Berlin Heidelberg, Berlin, Heidelberg, 2018, pp. 211–267. [Google Scholar]
- B. Iooss, P. Lemaître: A review on global sensitivity analysis methods, in: C. Meloni and G. Dellino, Eds., Uncertainty Management in Simulation-Optimization of Complex Systems: Algorithms and Applications. Springer, 2015. https://hal.science/hal-00975701. [Google Scholar]
- K.D. Hjelmstad: Wave Propagation in Linear Planar Beams. Springer International Publishing, Cham, 2022, pp. 305–361. [Google Scholar]
- A. Cazzani, F. Stochino, E. Turco: On the whole spectrum of timoshenko beams. Part I: a theoretical revisitation. Zeitschrift für angewandte Mathematik und Physik 67, 2 (2016) 24. [Google Scholar]
- G.R. Cowper: The shear coefficient in timoshenko’s beam theory. Journal of Applied Mechanics 33, 2 (1966) 335–340. [Google Scholar]
- P.M. Heck, A. Rotermund, S.C. Langer: Characterisation methods of the viscoelastic properties of plastics in multi-material designs, in: Fortschritte der Akustik – DAGA 2024, Hannover, Germany, 2024, pp. 706–709. [Google Scholar]
- P. Virtanen, R. Gommers, T.E. Oliphant, M. Haberland, T. Reddy, D. Cournapeau, E. Burovski, P. Peterson, W. Weckesser, J. Bright, S.J. van der Walt, M. Brett, J. Wilson, K. Jarrod Millman, N. Mayorov, A.R.J. Nelson, E. Jones, R. Kern, E. Larson, C.J. Carey, I. Polat, Y. Feng, E.W. Moore, J. VanderPlas, D. Laxalde, J. Perktold, R. Cimrman, I. Henriksen, E.A. Quintero, C.R. Harris, A.M. Archibald, A.H. Ribeiro, F. Pedregosa, P. van Mulbregt, SciPy 1.0 Contributors: SciPy 1.0: Fundamental Algorithms for Scientific Computing in Python. Nature Methods 17 (2020) 261–272. [Google Scholar]
- International Organization for Standardization: Plastics – determination of dynamic mechanical properties – Part 1: General principles. Technical Report ISO 6721-1:2019, 2019. German version EN ISO 6721-1:2019. [Google Scholar]
- ABAQUS, Inc.: ABAQUS Online Documentation: Version 6.6-1. Providence, RI, USA, 2006. [Google Scholar]
- F.G. Kollmann: Maschinenakustische Grundgleichung. Springer Berlin Heidelberg, Berlin, Heidelberg, 2000, pp. 169–176. [Google Scholar]
- Deutsches Institut für Normung (DIN): Electroacoustics – octave-band and fractional-octave-band filters – Part 1: Specifications, October 2014. German version EN 61260-1:2014; original in German; 47 pages. DOI: https://dx.doi.org/10.31030/2231136. [Google Scholar]
- B. Sudret: Polynomial chaos expansions and stochastic finite element methods, in: J.C. Kok-Kwang Phoon, Ed., Risk and Reliability in Geotechnical Engineering. CRC Press, 2015, pp. 265–300. https://hal.science/hal-01449883. [Google Scholar]
- T. Homma, A. Saltelli: Importance measures in global sensitivity analysis of nonlinear models. Reliability Engineering & System Safety 52, 1 (1996) 1–17. https://www.sciencedirect.com/science/article/pii/0951832096000026. [Google Scholar]
- J. Herman, W. Usher: SALib: An open-source python library for sensitivity analysis. The Journal of Open Source Software 2, 9 (2017) 97. [Google Scholar]
- T. Iwanaga, W. Usher, J. Herman: Toward SALib 2.0: advancing the accessibility and interpretability of global sensitivity analyses. Socio-Environmental Systems Modelling 4 (2022) 18155. https://sesmo.org/article/view/18155. [Google Scholar]
- P.M. Heck: Semi-analytical 1D ABH beam model [code]. GitHub, 2025, https://github.com/PhilippMHeck/semi_analytical_1d_abh_beam_model. [Google Scholar]
- R.J. Allemang: The modal assurance criterion- twenty years of use and abuse. Sound and Vibration 37 (2003) 14–23. https://api.semanticscholar.org/CorpusID:54191074. [Google Scholar]
Appendix A
Derivation of the linear system of equations for the semi-analytical ABH model
The boundary conditions (Eqs. (13)–(20)) are shown in general terms below using equations (5)–(7).
E 1 I 1 ψ(x 1 = 0, t)=0:
 (A.1)
(A.1)

 (A.2)
(A.2)
E i I i ψ i | x i = l i = E i + 1 I i + 1 ψ i + 1| x i + 1 = 0:
![Mathematical equation: $$ \begin{aligned}&E_i I_i\left[-\frac{\hat{W}_{i_1}}{\overline{\zeta }_{i_1}} \left(\overline{\zeta }_{i_1}^2+\mathrm{\Omega }^2\frac{\rho _i}{\kappa G_i} \right) -\frac{\hat{W}_{i_2}}{\overline{\zeta }_{i_2}} \left(\overline{\zeta }_{i_2}^2+\mathrm{\Omega }^2\frac{\rho _i}{\kappa G_i} \right)\right. -\left.\frac{\hat{W}_{i_3}}{\overline{\zeta }_{i_3}} \left(\overline{\zeta }_{i_3}^2+\mathrm{\Omega }^2\frac{\rho _i}{\kappa G_i} \right) -\frac{\hat{W}_{i_4}}{\overline{\zeta }_{i_4}} \left(\overline{\zeta }_{i_4}^2+\mathrm{\Omega }^2\frac{\rho _i}{\kappa G_i} \right)\right]\nonumber \\&\quad + E_{i+1} I_{i+1} \left[\frac{\hat{W}_{i+1_1}}{\overline{\zeta }_{i+1_1}}\left(\overline{\zeta }_{i+1_1}^2+\mathrm{\Omega }^2\frac{\rho _{i+1}}{\kappa G_{i+1}} \right)\right. +\left. \frac{\hat{W}_{i+1_2}}{\overline{\zeta }_{i+1_2}}\left(\overline{\zeta }_{i+1_2}^2+\mathrm{\Omega }^2\frac{\rho _{i+1}}{\kappa G_{i+1}} \right)\right.\nonumber \\&\quad + \frac{\hat{W}_{i+1_3}}{\overline{\zeta }_{i+1_3}}\left(\overline{\zeta }_{i+1_3}^2+\mathrm{\Omega }^2\frac{\rho _{i+1}}{\kappa G_{i+1}} \right) +\left.\frac{\hat{W}_{i+1_4}}{\overline{\zeta }_{i+1_4}}\left(\overline{\zeta }_{i+1_4}^2+\mathrm{\Omega }^2\frac{\rho _{i+1}}{\kappa G_{i+1}} \right) \right] = 0. \end{aligned} $$](/articles/aacus/full_html/2026/01/aacus250122/aacus250122-eq62.gif) (A.3)
(A.3)
 :
:
![Mathematical equation: $$ \begin{aligned}&G_i \kappa A_i \left[ \hat{W}_{i_1} e^{\overline{\zeta }_{i_1} l_i} \left(\overline{\zeta }_{i_1}-\frac{1}{\overline{\zeta }_{i_1}}\left(\overline{\zeta }_{i_1}^2 + \mathrm{\Omega }^2\frac{\rho _i}{G_i \kappa }\right) \right)\right. +\left. \hat{W}_{i_2} e^{\overline{\zeta }_{i_2} l_i} \left( \overline{\zeta }_{i_2}-\frac{1}{\overline{\zeta }_{i_2}}\left(\overline{\zeta }_{i_2}^2 + \mathrm{\Omega }^2\frac{\rho _i}{G_i \kappa }\right) \right)\right. \nonumber \\&\quad +\hat{W}_{i_3} e^{\overline{\zeta }_{i_3} l_i} \left( \overline{\zeta }_{i_3}-\frac{1}{\overline{\zeta }_{i_3}}\left(\overline{\zeta }_{i_3}^2 + \mathrm{\Omega }^2\frac{\rho _i}{G_i \kappa }\right) \right) +\left.\hat{W}_{i_4} e^{\overline{\zeta }_{i_4} l_i} \left( \overline{\zeta }_{i_4}-\frac{1}{\overline{\zeta }_{i_4}}\left(\overline{\zeta }_{i_4}^2 + \mathrm{\Omega }^2\frac{\rho _i}{G_i \kappa }\right) \right) \right]\nonumber \\&\quad - G_{i+1}\kappa A_{i+1} \left[\hat{W}_{i+1_1} \left( \overline{\zeta }_{i+1_1} -\frac{1}{\overline{\zeta }_{i+1_1}}\bigg (\overline{\zeta }_{i+1_1}^2 \right.\right. +\!\left. \mathrm{\Omega }^2\frac{\rho _{i+1}}{G_{i+1} \kappa }\bigg ) \right) + \hat{W}_{i+1_2} \left( \overline{\zeta }_{i+1_2}-\frac{1}{\overline{\zeta }_{i+1_2}}\bigg (\overline{\zeta }_{i+1_2}^2\right.\nonumber \\&\quad +\left. \mathrm{\Omega }^2\frac{\rho _{i+1}}{G_{i+1} \kappa }\bigg ) \right) +\hat{W}_{i+1_3} \left( \overline{\zeta }_{i+1_3}-\frac{1}{\overline{\zeta }_{i+1_3}}\bigg (\overline{\zeta }_{i+1_3}^2 \right. +\left. \mathrm{\Omega }^2\frac{\rho _{i+1}}{G_{i+1} \kappa }\bigg ) \right)+ \hat{W}_{i+1_4} \left( \overline{\zeta }_{i+1_4}-\frac{1}{\overline{\zeta }_{i+1_4}} \bigg (\overline{\zeta }_{i+1_4}^2\right. \nonumber \\&\quad +\!\left.\left. \mathrm{\Omega }^2\frac{\rho _{i+1}}{G_{i+1} \kappa }\bigg ) \right)\right] = 0. \end{aligned} $$](/articles/aacus/full_html/2026/01/aacus250122/aacus250122-eq64.gif) (A.4)
(A.4)
w i | x i = l i = w i + 1| x i + 1 = 0:
 (A.5)
(A.5)
ψ i | x i = l i = ψ i + 1| x i + 1 = 0:
 (A.6)
(A.6)
E n I n ψ(x n = l n , t)=0:
 (A.7)
(A.7)
 :
:
![Mathematical equation: $$ \begin{aligned}&G_{n} \kappa A_{n} \left[ \left(\overline{\zeta }_{n_{1}} -\frac{1}{\overline{\zeta }_{n_{1}}} \left(\overline{\zeta }_{n_{1}}^{2}+\mathrm{\Omega }^{2}\frac{\rho _{n}}{\kappa G_{n}}\right)\right)e^{\overline{\zeta }_{n_{1}}l_{n}}\hat{W}_{n_{1}} \right. +\left.\left(\overline{\zeta }_{n_{2}} -\frac{1}{\overline{\zeta }_{n_{2}}} \left(\overline{\zeta }_{n_{2}}^{2}+\mathrm{\Omega }^{2}\frac{\rho _{n}}{\kappa G_{n}}\right)\right)e^{\overline{\zeta }_{n_{2}}l_{n}}\hat{W}_{n_{2}}\right. \nonumber \\&\quad +\left(\overline{\zeta }_{n_{3}} -\frac{1}{\overline{\zeta }_{n_{3}}} \left(\overline{\zeta }_{n_{3}}^{2}+\mathrm{\Omega }^{2}\frac{\rho _{n}}{\kappa G_n}\right)\right)e^{\overline{\zeta }_{n_{3}}l_{n}}\hat{W}_{n_{3}} +\left. \left(\overline{\zeta }_{n_{4}} -\frac{1}{\overline{\zeta }_{n_{4}}} \left(\overline{\zeta }_{n_{4}}^{2}+\mathrm{\Omega }^{2}\frac{\rho _{n}}{\kappa G_n}\right)\right)e^{\overline{\zeta }_{n_{4}}l_{n}}\hat{W}_{n_{4}} \right] = \hat{F}. \end{aligned} $$](/articles/aacus/full_html/2026/01/aacus250122/aacus250122-eq69.gif) (A.8)
(A.8)
Equations (A.1)–(A.8) can be converted into a matrix vector notation
 (A.9)
(A.9)
for each frequency step, in order to determine the vector of the unknown variables of the translation movement. However, equations (A.3)–(A.6) are repeated depending on the number of sub-elements, which leads to a matrix dimension of 4n × 4n.
Appendix B
Sparse pattern of the matrix of the linear equation system
Figure B.1 shows the matrix structure of the semi-analytical ABH model for two different resolution variants of the ABH range: on the left with three elements and on the right with 51 elements. As the number of elements increases, the matrix becomes increasingly sparse.
 |
Figure B.1. Visualisation of the non-zero values of the linear equation system of the semi-analytical ABH model using a total of left: 3 elements and right: 51 elements. |
Appendix C
Convergence studies
To validate the semi-analytical approach with FEM, convergence studies are carried out to determine both the required number of nodes per bending wavelength (n CPS8R, see Eq. (23)) and the necessary number of beam elements (n Beam, see Eqs. (21) and (22)). The convergence variable used is the smallest FRAC value of the octave band spectrum, which corresponds to the largest deviations between two frequency responses within the respective octave band, calculated with different numbers of nodes or elements. For more details on the calculation of FRAC, see Appendix E.
Figure C.1 shows that convergence is achieved with an increasing number of nodes or beam elements. Eleven nodes are used for the FEM model and 51 beam elements for the semi-analytical model. Since the FE model also has to be resolved in terms of geometry, an additional check was made to see whether additional geometric resolution of the ABH area with 50 elements using equations (21) and (22) would change the dynamic behaviour – which is not the case. The decision to use more elements than necessary in the semi-analytical model is based on the fact that, within the scope of the sensitivity analysis, it is not possible to perform a separate convergence study for each parameter combination. As a result, a higher number of elements is selected in order to resolve the ABH area of all combinations with sufficient accuracy.
 |
Figure C.1. Convergence studies for the required number of top: nodes for the FE model and bottom: beam elements for the semi-analytical model. |
Appendix D
Phase frequency response of the validation
Figure D.1 shows the phase frequency response of the validation model using the analytical model presented and the finite element method.
 |
Figure D.1. Phase frequency response of the FEM simulation and the semi-analytical approach of the ABH geometry defined for validation (see Sect. 2.2). |
Appendix E
Frequency Response Assurance Criterion (FRAC)
Assuming that two frequency response curves describe the same input/output relationship, their agreement can be checked using the frequency response agreement criterion (FRAC) [38]. If the same discrete frequencies are considered, a dimensionless value between 0 and 1 – for all or part of the frequency range – can be determined as follows [38]:
 (E.1)
(E.1)
ω 1, ω 2 define the lower and upper limits of the frequency range. The variables h T, sim and h T, anal denote the frequency response of the simulation and that of the semi-analytical model. The value of 0 describes no fit, value of 1 means both frequency response curves are identical. In this contribution, the FRAC values for the individual octave bands are calculated in accordance with DIN EN 61260-1 [32].
Cite this article as: Heck P.M. Ring T.P. & Langer S.C. 2026. Semi-analytical Timoshenko beam model for symmetrical 1D acoustic black holes: Efficient quantification of the influence of geometric model parameters on vibration behaviour. Acta Acustica, 10, 60. https://doi.org/10.1051/aacus/2026054.
All Tables
Frequency-dependent viscoelastic material properties for structural and damping domains.
All Figures
|
Figure 1. Schematic representation of a 1D symmetrical ABH with damping layer on both sides. |
| In the text | |
|
Figure 2. Schematic representation of the discretised semi-analytical ABH model. |
| In the text | |
|
Figure 3. Schematic representation of the simulation model of a linear symmetric 1D ABH, meshed with CPS8R elements. |
| In the text | |
|
Figure 4. Comparison of a continuous frequency spectrum and the octave spectrum for the level of the mean square mobility L h T 2 . |
| In the text | |
|
Figure 5. Convergence study based on the Sobol total index for the required number of samples. |
| In the text | |
|
Figure 6. Comparison of FEM simulation and semi-analytical approach of the ABH geometry defined for validation; Top: level of surface velocity; Bottom: relative error of resonance points (red) and frequency response assurance criterion for each octave band (blue). |
| In the text | |
|
Figure 7. Level of the mean square mobility of a uniform beam with damping layer and a beam with integrated ABH. |
| In the text | |
|
Figure 8. Estimated Sobol indices for the eight octave bands with 163 840 samples. Top: Sobol index of the first order. Bottom: Sobol index of the total order. |
| In the text | |
|
Figure 9. Interaction maps of the geometric parameters in the specific octave band using the second-order Sobol index S ij . |
| In the text | |
|
Figure 10. Influence of selected geometric ABH parameters on the vibration behaviour of 1D symmetric ABH structures. |
| In the text | |
|
Figure B.1. Visualisation of the non-zero values of the linear equation system of the semi-analytical ABH model using a total of left: 3 elements and right: 51 elements. |
| In the text | |
|
Figure C.1. Convergence studies for the required number of top: nodes for the FE model and bottom: beam elements for the semi-analytical model. |
| In the text | |
|
Figure D.1. Phase frequency response of the FEM simulation and the semi-analytical approach of the ABH geometry defined for validation (see Sect. 2.2). |
| In the text | |
Current usage metrics show cumulative count of Article Views (full-text article views including HTML views, PDF and ePub downloads, according to the available data) and Abstracts Views on Vision4Press platform.
Data correspond to usage on the plateform after 2015. The current usage metrics is available 48-96 hours after online publication and is updated daily on week days.
Initial download of the metrics may take a while.